


2018 School Spending Survey Report
A Complex Landscape | Budgets and Funding 2024
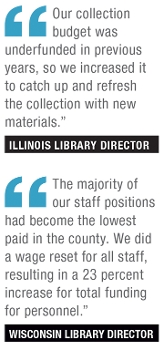
Budgets grew across all areas in 2023, and while it’s too early to predict what those gains bode, the upward trend is largely encouraging.
Budgets grew across all areas in 2023, and while it’s too early to predict what those gains bode, the upward trend is largely encouraging
 In the runup to November’s general election, there are a number of critical issues in play. Perhaps the most important to the majority of Americans—and, in some ways, the most contested—is the state of the national economy. As of December 2023, according to the Bureau of Labor Statistics, unemployment was down, payroll employment and average hourly earnings were up, and inflation had slowed after a sharp rise earlier in the year. Yet consumer confidence has been slow to reflect the modest gains since the lows of mid-2022, and the average American’s economic well-being will be a key selling point for candidates at all levels, from city councilmembers to the U.S. president.
One indicator of growing economic health that won’t be found in other consumer indexes is the solid increase in library budgets from 2022 to 2023. LJ’s 2024 Budgets and Funding survey, sponsored by Baker & Taylor, received responses from 273 U.S. public libraries between November 17 and December 14, 2023, and the news was generally good across the board.
Total operating budgets rose an impressive 7.9 percent, the largest increase in a decade. Materials budgets didn’t see the previous year’s notable jump of 5.1 percent, but rose by a respectable 3.5 percent. Personnel expenses—not only salaries, benefits, and FICA, but professional development for staff—saw a particularly healthy 9.4 percent boost, demonstrating that libraries are allocating money to the programs, services, and materials that support their communities, and are also prioritizing the employees who make it all happen.
A COMPLEX LANDSCAPE
Attributing budget growth to a recovering economy is only one way of looking at an extremely complex landscape, of course. Just as libraries are hyperlocal entities, the factors that contribute to funding expansions or cuts reflect local concerns. These are not only economic, but—particularly in the past few years, as libraries have increasingly become the targets of censorship agendas—political. Last fall’s elections saw an uptick in library measures on ballots across the country, the majority of which passed, but most renewed existing funding rather than looking for new money (see “Keeping Libraries Right Side Up”).
In addition, some of the positive numbers provided in this year’s survey represent corrections to 2022 shortfalls, increases in local property taxes and sales revenue, countywide cost of living adjustments, and one-time federal infusions. For smaller libraries, a significant budget uptick might be the result of successfully budgeting for one or two new positions, or an increase in paid resources such as passport services.
Still, this year’s change in operating, materials, and personnel budgets continues the upward trend begun last year, as libraries move further away from the pandemic-related constraints of 2020 and 2021. Eighty-four percent of responding libraries reported an increase in operating budgets, 63 percent grew their materials budgets, and 89 percent noted an increase in personnel budgets. The average total operating budget in this year’s sample was $9,339,000, up nearly 8 percent from the previous year’s $8,658,800—the largest jump since LJ began tracking in 2011.
|
BUDGET CHANGES FROM 2022 TO 2023 |
|||
| Total Operating Budgets | Materials Budget | Personnel Budgets | |
| 2023 Average | $9,339,000 | $994,700 | $5,353,700 |
| Increased | 84% | 63% | 89% |
| Decreased | 13% | 21% | 9% |
| No Change | 3% | 16% | 1% |
| Net % change | + 7.9 | + 3.5 | + 9.4 |
|
SOURCE: LJ BUDGETS & FUNDING SURVEY 2024 |
|||
PAYING FOR TECH
Technology remains a priority, both budgeting for new tools and maintaining existing tech. As more patrons return to in-person library use, hardware such as laptops and printers need replacing and upgrading, and connectivity remains a prime concern. “The library continues to invest in its technology infrastructure and technology replacement plan,” notes Ray Baker, director of the Miami-Dade Public Library System, which is making use of a federal Library Services and Technology Act (LSTA) Sustaining Community Connectivity Grant. “As part of the 2023–2024 budget, the library system will be replacing all servers in its Data Center and replacing over 500 staff and public desktops.”
Although average technology expenditures were lower than last year’s—$408,100, versus 2022’s $453,700—they remain well above the cumulative average of $350,800 since 2018. This also hasn’t dampened plans for the future; despite an average 10 percent decrease from last year, 49 percent of libraries also predicted that tech outlays will increase in 2024.
Responding libraries estimated that one-third of their technology spending will be allocated to enterprise software such as their integrated library system (ILS). Hardware purchases (computers, 3-D printers, or scanners), other software purchases and upgrades, and internet access each account for nearly 20 percent more of their tech budgets. Another 6 percent went toward large hardware purchases such as digital kiosks.
CONNECTING, RECONNECTING
Outreach spending, understandably, is still high compared with pre-pandemic years—libraries remain invested in bringing patrons back in and forging strong community connections.
However, less than half (45 percent) reported spending on outreach during the last fiscal year, with an average of $119,300 per system. The largest libraries spent more than four times as much on outreach as the next size down, and only 10 percent of the smallest libraries spent on outreach at all.
Those outreach efforts are part of a larger trend—the search for imaginative ways to engage existing customers and bring new ones aboard—which has only become more critical since the disruptions and disconnections of COVID (see “Hungry for Connection,” pp. 12–15). The average spent on programming in 2023 was $109,000, a 43 percent jump between 2022 and 2023, with the largest libraries spending far and away the most—an average of $950,700. Half of this year’s sample expect to further increase spending on programs next year.
Although there is a steadily growing need for libraries to advocate for budget votes in politically charged local races, and to gain public support on censorship issues, only 7 percent of responding libraries allocated budget money specifically for lobbying or advocacy services in 2023. That number rose to about 11 percent in urban and suburban libraries, and in independent library districts.
“This funding is merged in our budget with two other areas—staff and board development and marketing,” notes Mary Medjo Me Zengue, director of Addison Public Library, IL. In another dedicated advocacy scenario, “The library employs a member of staff whose responsibilities include government relations, focusing primarily on issues related to local and state library funding,” says Carnegie Library of Pittsburgh Director of Finance and Administration Linda Barsevich. “The library also retains a lobbying firm.”
An additional 4 percent of libraries are considering dedicating such funding next year, but overall, 90 percent have no plans to do so.
|
CIRCULATION, HOURS, AND STAFFING CHANGES FROM 2022 TO 2023 |
|||
| Circulation | Weekly Open Hours | FTE Staffing | |
| Average | 982,600 | 49.1 | 55.7 |
| Increased | 66% | 13% | 32% |
| Decreased | 10% | 4% | 11% |
| No Change | 25% | 83% | 57% |
| Net % change | + 6.1 | + 0.4 | + 1.4 |
|
SOURCE: LJ BUDGETS & FUNDING SURVEY 2024 |
|||
THE MATERIAL WORLD
The average proportion of the budget that went to digital materials remained at 27.2 percent, nominally higher than 2022’s 26.5 percent—although just under half of libraries (46 percent) said that this represented an increase over the previous year.
The overall rise in digital spending was 4.2 percent, representing the smallest increase in the past five years. Only 5 percent of responding libraries stated that they had decreased digital spending. Urban and suburban libraries devoted the greatest part of their budgets—more than 30 percent—to digital materials.
The average circulation for 2022 (or the last complete year measured) was 982,600. The average per capita circulation—both print and digital—was 7.86 items, down from last year’s 8.07 and continuing a downward trend over the past decade (with an isolated uptick in 2017). While the Midwest has traditionally led per capita counts, last year the West/Mountain region saw the highest numbers, with 9.5 average per cap circulation.
Responding libraries represented the full range of service area size, in this instance led by the smallest libraries—the most survey responses came from libraries serving fewer than 10,000 residents. Well over half of the sample (60 percent) have a single location. The average number of locations for the entire survey sample is 3.9.
|
FUNDING CHANGES FROM 2022 TO 2023 |
|||
| Local Funding* | State Funding | Grant Funding | |
| Increased | 67% | 26% | 24% |
| Decreased | 4% | 6% | 6% |
| No Change | 30% | 50% | 52% |
| n/a | 19% | 18% | |
| Net % change | + 5.2 | + 2.6 | + 10.5 |
|
SOURCE: LJ BUDGETS & FUNDING SURVEY 2024 *Libraries subject to local budget appropriations |
|||
STAFF MATTERS
Libraries in this year’s survey had an average of 55.7 FTE staffing; nearly one-third (32 percent) increased their number of employees. Eleven percent reported a decrease. Overall, libraries added 1.4 FTE, with the increase mostly seen at the larger libraries. Several libraries reported instituting wage resets for low-paying salaries across the organization; one Wisconsin library noted that this resulted in a 23 percent increase for total personnel funding.
For smaller libraries, adding staff is a necessity as services have expanded—and can impact other areas of the budget in positive ways.
“We requested additional staff in FY23–24, citing the length of time since our last staff increase, how many more patrons we serve now, and the variety of safety concerns we have faced in the last few years,” says Bethany Jones, director of Dandridge Memorial Library, TN, which serves a population of 20,400. “Our materials budget increase was smaller but was based on inflation and the need to meet a state standard of 10 percent of the budget being spent on materials—with such a large staff increase, a large materials increase was needed as well to get closer to meeting this standard.”
Fifty-seven percent of total operating budgets went toward personnel and benefits, for an average spend per FTE of $74,832—up 7.8 percent over the previous year. And salaries weren’t the only place that libraries demonstrated the value they place on employees. Ninety-three percent spent money on staff professional development in 2023—although the dollar amount spent dropped an average of 19 percent from 2022, for an average of $27,600. At the largest libraries, a full 100 percent offer professional development, although a third of those predict that they will spend less next year. Across the board, however, nearly half (46 percent) of libraries in the sample expect to spend more on training for staff in the coming year.
Staffing levels certainly impact open hours, which averaged 49.1 hours per location in 2023, slightly down from last year’s 49.5. While not quite at pre-pandemic levels, they are nearing 2019’s average of 51.7. Thirteen percent of libraries increased hours in 2023, adding an average of 0.4 hours per location, or 4.2 hours per district. The largest added an average of 1.6 weekly hours per location.
|
ANTICIPATED SPENDING CHANGES FROM 2023 TO 2024 |
|||
| Technology Spending | Outreach Spending | Programming Spending | |
| 2023 Average* | $408,100 | $119,300 | $109,000 |
| Increase | 49% | 32% | 50% |
| Decrease | 15% | 9% | 6% |
| No Change | 36% | 59% | 44% |
|
SOURCE: LJ BUDGETS & FUNDING SURVEY 2024 *based on libraries spending on each |
|||
CONSIDER THE SOURCE
Over half of the libraries in this year’s sample—59 percent—are subject to local budget appropriation; 35 percent are funded through an independent library taxing district. Municipally funded libraries experienced a greater increase in operating budgets, at 9.4 percent, while those in independent districts grew by 6.5 percent.
For the most part, the numbers bear out the benefits of steadier tax-based funding that isn’t dependent on economic fluctuations or the politics of elected officials—even more so if tax-based revenue is mandated by legislature, such as Denver’s Ballot Measure 2I, passed in fall 2022, which increased the property tax rate by 1.5 mills and dedicated those funds to Denver Public Library. The operating budgets of libraries subject to local appropriation averaged $8.6 million, 11 percent less than the $9.7 million reported by independent district libraries. The materials budgets at libraries dependent on local government for funding were almost 25 percent smaller than those in independent districts, and personnel budgets 14 percent smaller.
However, funding based on local taxes can suffer if elected officials lower those taxes to appease other constituents. “We are facing a significant decrease—possibly up to 20 percent—in funding for FY24 because our state legislature has just now radically reduced the property tax rates, our primary source of income,” says Anthony Masinton, director of La Veta Regional Library District, CO, which serves a population of 1,400.
Of local government–funded libraries, two-thirds (67 percent) received an increase in local support in 2023—up 5.2 percent from 2022, the largest year over year increase in local funding since LJ began measuring that impact in 2015.
State funding also increased across all regions of the country in 2023, with an overall net growth of 2.6 percent. This was particularly welcome after the decreases seen in 2020 and 2021, and an improvement over last year’s 1.6 percent uptick.
Grant funding saw a solid hike of almost 11 percent over the previous year, with urban libraries and libraries in the West/mountain regions seeing the most significant increases—34 percent and almost 42 percent respectively. However, this represents slower growth in grant trending than libraries have seen in several years, particularly compared with 2021’s overall increase of nearly 31 percent.
Federal or state assistance, such as American Rescue Plan Act (ARPA); Coronavirus Aid, Relief, and Economic Security (CARES) Act; or Digital Equity Act funding continues to slow along with the worst of the pandemic impacts. This year 55 percent of libraries received federal or state grant money, down from the emergency grant funds 79 percent of libraries received in the thick of the pandemic crisis in FY21–22.
This money was most often spent on capital improvements, materials, programming, and technology—and some is still earmarked for COVID spread mitigation, such as the $60,000 in ARPA funds noted by Dandridge Memorial Library’s Jones, distributed by the county over three fiscal years (FY22–23 through FY24–25) for health safety improvements to the facility.
Donors’ pockets were deeper, although not dramatically. For the more than three-quarters of libraries with active Friends groups, that funding increased by an average of 7 percent, with small-town and rural libraries reporting the largest increases—over 12 percent. Libraries with foundations—nearly two-fifths of those surveyed—saw an average increase of 2.7 percent; suburban libraries had the strongest foundation support, at 13.5 percent. Individual and corporate gifts were received by 61 percent of libraries, but the average increase from 2022 only rose by 1.7 percent. Those gifts remained essentially flat for 43 percent of the sample, although urban libraries did well at an average uptick of 8.6 percent.
EYES ON THE HORIZON
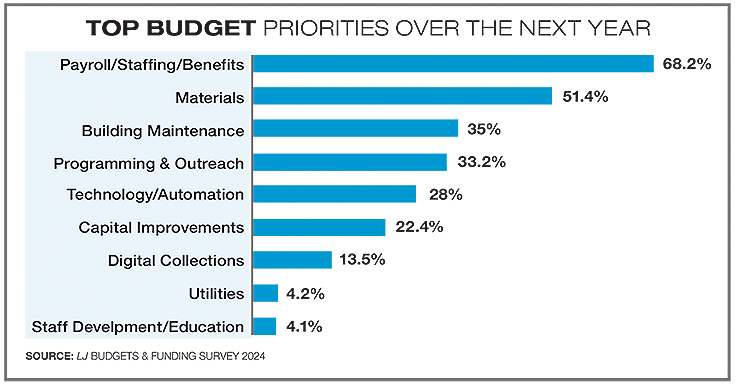
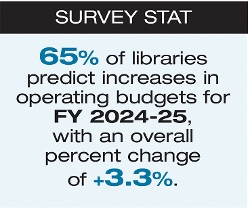
Despite a variety of challenges—politically conservative groups trying to hobble libraries on moralistic or political grounds, a lack of consumer confidence affecting tax revenues, or city budget freezes—library leaders are largely optimistic about their prospects going forward, with 65 percent looking to an increase and only 6 percent anticipating a decrease. Net changes in operating budgets are predicted to increase by 3.3 percent next year. Payroll and salaries lead the projected priorities for 2024, followed by materials and building maintenance.
 More than a third (36 percent) are considering a major technology investment over the next year, with a refresh of both public-use and staff computers topping the list. Other planned purchases include self-checkout expansions, Wi-Fi upgrades, a new ILS, security cameras and gates, automated materials handling, new phone systems, and book lockers. Still other respondents envisioned a data warehouse, a telehealth hub, and passive occupancy technology (people counters).
And even with the ongoing decline in circulation numbers, two-thirds of respondents expect to see a rise in circ during the coming year, for overall growth of 6.1 percent. Circulation increases are expected across the board.
There has always been a great deal of uncertainty in the library funding arena, and with a contentious presidential election on the horizon and ongoing stalemates within Congress over the federal budget, libraries are standing on shifting sands. But they have always done so, and current numbers bear out the fact that libraries have survived the most recent threats to their ongoing security, and continue to prevail.
ADDITIONAL DATATo see LJ’s full 2024 Public Library Budget Survey, download the report here. |

Added To Cart
RELATED


RECOMMENDED


TECHNOLOGY

ALREADY A SUBSCRIBER? LOG IN
We are currently offering this content for free. Sign up now to activate your personal profile, where you can save articles for future viewing
ALREADY A SUBSCRIBER? LOG IN
Thank you for visiting.
We’ve noticed you are using a private browser. To continue, please log in or create an account.
Add Comment :-
Comment Policy:
Comment should not be empty !!!