


2018 School Spending Survey Report
Gaining Ground Unevenly | Budgets & Funding
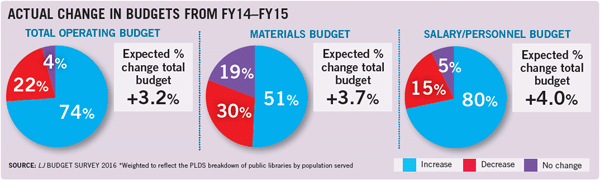
LJ’s 2016 survey of U.S. public libraries, distributed geographically by size and type, reveals that while libraries continue to regain lost ground, recovery is gradually slowing—and not evenly distributed. Libraries reported moderate gains in overall budgets—an across-the-board increase of 3.2%, representing funding from all sources. Combined with a slight drop in inflation rates—.5% over the 12 months ending in November, compared to .8% for the preceding year—this is still smaller than last year’s overall uptick of 4.3% but welcome nonetheless.
The good news in last year’s budget survey continues, although at a more reserved pace. LJ’s 2016 survey of U.S. public libraries, distributed geographically by size and type, reveals that while libraries continue to regain lost ground, recovery is gradually slowing—and not evenly distributed. Libraries reported moderate gains in overall budgets—an across-the-board increase of 3.2%, representing funding from all sources. Combined with a slight drop in inflation rates—.5% over the 12 months ending in November, compared to .8% for the preceding year—this is still smaller than last year’s overall uptick of 4.3% but welcome nonetheless.
Of the 371 responding libraries, 74% reported an increase in their total operating budgets from 2014 to 2015—a single percentage point more than last year’s more dramatic rise to 73% from the previous year’s 68% (and 60% the year before that). The overall percentage change in materials budgeting was notable, however, with materials budgets up 3.7%. This represents a significant increase over last year’s 1.5%. (For more information, see the upcoming annual Materials Survey, LJ 2/15/16.)
Salary and personnel budgets continued to rise, although, again, not quite at last year’s rates. Salary budgets rose 4%, with 80% of the libraries surveyed reporting budget gains from 2014 to 2015. These not only augmented existing salaries but went toward an increase in personnel. An average of one full-time equivalent (FTE) staff member was added per library system last year, for a healthy increase in staffing of 29% for the responding libraries.
Yet while the numbers reported for 2015 were positive overall, these gains were not consistent across the landscape.
Size matters
Libraries serving small towns and rural areas are still working to catch up to prerecession levels. And this encompasses a lot of libraries; nearly half the systems in LJ’s sample consist of a single building, with the average maintaining five locations. Wisconsin’s Muehl Public Library, serving a population of 7,000, is typical—holding steady but precariously.
“We don’t have a fund if the roof needs to be repaired,” Director Elizabeth Timmins told LJ. “We do have a capital outlay line, but it’s not enough for a major overhaul.”
As with last year’s results, budget growth was roughly in proportion to library size. Libraries serving populations of 10,000–49,999 reported the smallest gains overall, with the most sizable increases occurring in the one million or more population demographic.
The discrepancies were considerable. Libraries serving populations of 25,000–49,999 showed gains in operating budgets of a mere .5%, sharply down from last year’s rise of 4.3%, with smaller libraries—those in the 10,000–24,999 range—only increasing by .9%. Contrasted with last year’s increase of 4.5% for those in the 10,000–25,000 range and 4.4% for the next largest, this indicates a major slowdown for mid- to small-size libraries. (The very smallest, however, with populations of under 10,000, did somewhat better, with a 3.3% increase.) Compare these to the operating budget growth for libraries serving one million or more, at 5.2%.
Smaller libraries demonstrated similar downturns in their materials budgets, with those serving 25,000–49,999 showing only a .9% gain. When it came to materials money the smallest libraries did not show any advantage either, with a comparable 1.2% increase. At the other end of the spectrum, the largest libraries’ materials budgets grew by 6.3%—increasing in proportion to library size, a trend broken only by inconsistently low 1.5% gains at the 500,000–999,999 population level.
Salaries, however, varied across the board. Increases at the 10,000–24,999 stratum were still the most modest, at 1.3%, but all other libraries reported more consistent gains, from 3% for libraries serving 25,000–49,999 and a strapping 4.9% at the 100,000–249,000 level.
BUDGET TRENDS
| Population Served | Total Operating Budget 2014 | Total Operating Budget 2015 | % Change in Operating Budget |
| Under 10,000 | $243,000 | $251,000 | 3.3 |
| 10,000–24,999 | 923,000 | 931,000 | 0.9 |
| 25,000–49,999 | 1,705,000 | 1,713,000 | 0.5 |
| 50,000–99,999 | 3,261,000 | 3,404,000 | 4.4 |
| 100,000–499,999 | 8,737,000 | 8,920,000 | 2.1 |
| 500,000–999,999 | 30,505,000 | 31,625,000 | 3.7 |
| 1 million or more | 58,414,000 | 61,466,000 | 5.2 |
| Population Served | Materials Budget 2014 | Materials Budget 2015 | % Change to Materials Budget |
| Under 10,000 | $32,700 | $33,100 | 1.20% |
| 10,000–24,999 | 101,500 | 103,100 | 1.6 |
| 25,000–49,999 | 217,000 | 219,000 | 0.9 |
| 50,000–99,999 | 383,000 | 398,000 | 3.9 |
| 100,000–499,999 | 1,028,000 | 1,074,000 | 4.5 |
| 500,000–999,999 | 3,672,000 | 3,726,000 | 1.5 |
| 1 million or more | 5,707,000 | 6,064,000 | 6.3 |
| Population Served | Salary Budget 2014 | Salary Budget 2015 | % Change to Salary Budget |
| Under 10,000 | $154,000 | $159,000 | 3.2 |
| 10,000–24,999 | 543,000 | 550,000 | 1.3 |
| 25,000–49,999 | 1,032,000 | 1,063,000 | 3 |
| 50,000–99,999 | 1,981,000 | 2,058,000 | 3.9 |
| 100,000–499,999 | 5,461,000 | 5,701,000 | 4.4 |
| 500,000–999,999 | 19,040,000 | 19,759,000 | 3.8 |
| 1 million or more | 39,613,000 | 41,139,000 | 3.9 |
| SOURCE: LJ BUDGET SURVEY 2016 *Weighted to reflect the PLDS breakdown of public libraries by population served | |||
More Wi-Fi, bigger gap
All per capita usage statistics overall dropped from those reported last year—with the exception of Wi-Fi, which has outpaced in-library computer usage, a trend that will likely increase. In-person library visits averaged about 5.21 per person served by the library on the whole, down from last year’s 5.89.
Last year, the smallest libraries saw the most usage of nearly all services, but this year those numbers were spread more evenly—however, the largest libraries showed significantly less usage of all services other than on-site computers. Small-town and rural library computer usage, on the other hand, lagged behind usage at their urban and suburban counterparts.
These computer use figures were noticeably lower than last year’s, and a number of directors surveyed tied this directly to lack of funding. The smaller the town, it seems, the larger the technology funding gap looms.
“We are struggling to meet the technological needs of the community,” says Katie Marsh, director of the Merriam-Gilbert Public Library, West Brookfield, MA, serving a population of 4,646. “Our computers are so old and heavily used that the funds we receive to purchase new computers must go toward replacing the few that we have.”
On-site stats
Libraries opened longer in 2015, with 9% of libraries reporting an increase in open hours. In 2015, libraries were open an average of 50 hours per week, still down from prerecession levels. Among the total sample of libraries, there was an overall increase of 2.5 hours per system, although the hours of individual locations, when averaged out, revealed no increase.
The largest libraries increased hours considerably. When New Yorkers protested Mayor Bill de Blasio’s projected budget cuts for FY16, their rallying chant was “Six-day service!”—and they got it. This year’s increase amounted to an average gain, for libraries serving over a million, of 108 hours per system. Midsize libraries boosted hours only incrementally, and the smallest saw their hours mostly unchanged.
Only 3% of the libraries surveyed opened a new location last year, gains canceled out by the 3% that closed a location. A notable 10% of responding libraries located in the West/Mountain region of the country opened new branches, but most—94%—reported no location changes.
CHANGE IN LOCAL FUNDING FROM FY14–FY15
| Population Served | % Increased | % Decreased | % No Change | Overall Change in # of Staff |
| Under 10,000 | 60 | 7 | 33 | 2.2 |
| 10,000–24,999 | 69 | 0 | 31 | 4 |
| 25,000–49,999 | 42 | 11 | 47 | 0.8 |
| 50,000–99,999 | 71 | 5 | 24 | 2.3 |
| 100,000–499,999 | 60 | 11 | 29 | 2 |
| 500,000–999,999 | 95 | 5 | 0 | 4.7 |
| 1 million or more | 91 | 9 | 0 | 4.5 |
| Total Weighted | 64 | 7 | 29 | 2.5 |
| SOURCE: LJ BUDGET SURVEY 2016 *Weighted to reflect the Public Library Data Service (PLDS) breakdown of public libraries by population served | ||||
CHANGE IN STATE FUNDING FROM FY14–FY15
| Population Served | % Increased | % Decreased | % No Change | Overall Change in # of Staff |
| Under 10,000 | 13 | 21 | 67 | -2 |
| 10,000–24,999 | 21 | 15 | 64 | -1.1 |
| 25,000–49,999 | 29 | 18 | 53 | -5.6 |
| 50,000–99,999 | 33 | 15 | 52 | 0.2 |
| 100,000–499,999 | 28 | 22 | 50 | -1.3 |
| 500,000–999,999 | 45 | 20 | 35 | 8.4 |
| 1 million or more | 78 | 11 | 11 | 6.4 |
| Total Weighted | 28 | 18 | 54 | -1.1 |
| SOURCE: LJ BUDGET SURVEY 2016 *Weighted to reflect the Public Library Data Service (PLDS) breakdown of public libraries by population served | ||||
Building up staff
On average, libraries increased their personnel by one full-time employee last year, for a weighted mean number of 66.6 per library system. More than half of the respondents (57%) and nearly three-quarters of the smallest libraries reported no change in staff size from 2014 to 2015. But an impressive 79% of the largest libraries, serving one million or more, increased their FTE rolls—by an average of 31 people per system.
Queens Library (QL) in New York was one of these, adding 129 staff members. Bridget Quinn-Carey, QL interim president and CEO, told LJ, “After years of cuts and reductions in our staff numbers...this is the first time we have been able to significantly add to our staff, which enables us to add to our services.”
While not quite back to pre-2008 levels, QL has been able to restore all previously cut positions and add another 100. “We ended up with about $12 million worth of additional funding over the last two fiscal years, after losing a heck of a lot more than that,” says Quinn-Carey. “We’re not quite back there.... But 12 [million] is really good. We’re on the way.”
These gains were balanced out by smaller libraries; those serving fewer than 10,000 people added an average of .1 employee, while the next largest segment averaged .3 fewer FTEs, and those serving 25,000–49,000 remained static. While Midwest libraries appear to be thriving in most other areas, they reported no average staffing increases, as opposed to urban libraries’ addition of an average 5.7 FTE. While libraries still have a way to go before they reach the 2008 average of 86 full-time employees, last year’s increase in funding (see “Paying for People,” LJ 2/1/15, p. 30) is beginning to show results.
Nearly half (47%) of library staff are employed full-time. The percentage rises along with the size of the library, with 64% of the largest libraries’ staff working full-time. Southern and urban libraries have the most full-timers, at an average of 60% each. Of the grand total, 18% are MLIS-credentialed librarians, a percentage that also rises with library size.
Trends and needs
When it came to changes in funding for various services, salaries represented the greatest rate of increase across all demographics, with 56% of the libraries surveyed budgeting more money for staffing. Technology and materials were close behind—but, as noted above, the bounty was not always evenly distributed.
“Technology is the biggest challenge for a small library,” notes Faye VanRavenswaay, Schoolcraft Community Library, MI (pop. 3,775), director. “Once the library acquires the needed computer equipment, we then must be able to replace and maintain that equipment. We also do not have a full-time IT staff member. We use someone on-call.”
Cutbacks were seen in several areas, with 28% of surveyed libraries reporting that they received less money for materials, followed by capital improvements, technology, staffing, and programs. But an impressive 43% said that no service areas saw reduced funding—a dramatic improvement over last year’s 14%.
Of the immediate needs highlighted when LJ asked respondents to identify specific areas that they were unable to serve owing to lack of funds, technology and outreach tied for first place, followed by programming and capital improvements. Outreach was the top challenge noted by suburban and small-town libraries. On a more encouraging note, 30% of respondents replied that there was no area they were unable to serve because of funding constraints.
Funding sources
Nearly two-thirds of the libraries included in LJ’s sample (62%) rely on annual local government appropriations for funding. A quarter (27%) are funded through an independent library district, with the Midwest most likely to have independent districts.
In general, local funding increased by 2.5% last year. These increases fluctuated across library size; midsize libraries in the 25,000–49,999 range lagged noticeably behind both larger and smaller districts, showing a gain of only 0.8%. By comparison, nearly all libraries serving populations of more than 500,000 received local funding increases of 4.5% or better, with the very smallest libraries averaging local funding increases of 2.2%. Changes were fairly uniform around all regions of the country, with suburban libraries leading the pack.
Libraries fared less well when it came to securing money at the state level. Overall state funding was down 1% from last year, harkening back to 2013’s 1.1% decrease—a disappointing showing after 2014’s solid 3.6% net gain. Discrepancies among district sizes were still more apparent at the state level, with libraries serving populations between 500,000 and a million increasing their state dollars by 8.4% and midsize libraries showing a decrease of 5.6%. State funding also seemed to favor suburban and rural libraries.
These numbers are worrisome to trend watchers such as John Chrastka, founder and executive director of EveryLibrary, a national political action committee for libraries (and a 2014 LJ Mover & Shaker). “I’m concerned that cuts to state aid in places like Missouri and Florida, and slow disbursements by states with long-term budget impasses like Pennsylvania and Illinois, erode the modest gains made at the local level through elections and new general fund allocations,” says Chrastka. “We all need to focus on our state legislatures with as much attention as we give our local voters and funding partners, or it’s a step back for every step up.”
Public referenda were held by 148 libraries nationwide last year, mostly on an operating budget vote. Ballot issues were most prevalent in the Northeast, and overall 86% of the ballot issues held by responding libraries passed. (For more on 2015 referenda, see “The Constant Campaign,” p. 32.)
A modest outlook
Last year, respondents offered modest predictions for the year to come, anticipating budgets increasing by 1.6%. This year’s actual gains doubled those forecasts, but a mood of caution still prevails. In LJ’s 2016 survey, library directors again projected a 1.6% rise. Similarly to last year, 12% expect to see budgets reduced. Libraries at the larger end of the scale were more optimistic that their funding would rise, and nearly three-quarters of suburban libraries predicted budget upswings next year.
As for the smallest libraries, many seem to be operating much like an individual living paycheck to paycheck. As Muehl PL’s Timmins puts it, “The mentality is: we put out the fire when we have a fire, instead of saving for the future.” However, she adds, “You make your dream work by using the resources at hand.”
Methodology
The LJ Budget Survey was distributed to a random sample of 1,700 U.S. public library directors on November 16, 2015, with a reminder on November 30. The directors list was obtained from Market Data Retrieval. The field closed on December 15, 2015, with a total of 371 libraries responding, an overall response rate of 22%.
The data was weighted by population served to even out fluctuations in respondent sample sizes in eachgroup. Weighted percentages and averages apply to total sample results only. Data appearing for specific population groups is unweighted.

Added To Cart
RELATED


RECOMMENDED


TECHNOLOGY

ALREADY A SUBSCRIBER? LOG IN
We are currently offering this content for free. Sign up now to activate your personal profile, where you can save articles for future viewing
ALREADY A SUBSCRIBER? LOG IN
Thank you for visiting.
We’ve noticed you are using a private browser. To continue, please log in or create an account.
Add Comment :-
Comment Policy:
Comment should not be empty !!!
Sarah
Here's what I would like to know: how many of these libraries had cuts starting in 2008, and of those, how many are back to pre-2008 levels. It's one thing to have a flat collection budget in 2015; it's another to have had a, say, 25% cut in a previous years without any restoration to date of that cut. Also, how to interpret the statistics for "population served" within each grouping? For instance, a 100K service population is between 50-99K and 100-249K. Would it be best to take the average of the 50-99K (say, 75K) and then extrapolate? It's difficult to know how to apply these statistics when the categories are so broad.Posted : Feb 18, 2016 12:53