


2018 School Spending Survey Report
Going for Gold, Deep in the Red
Can libraries afford open access? LJ’s latest Periodicals Price Survey examines the state of the market.
 Can libraries afford open access? LJ’s latest Periodicals Price Survey examines the state of the market
Athletes with their eyes on a gold medal know it can take years of hard work, patience, and a little bit of luck to achieve. Often, the gold is tantalizingly close but just out of reach. For many in scholarly communications, the same could be said of the path to open access (OA), where flipping a publication to gold OA remains the ultimate victory.
Having survived the budget uncertainties following the Great Recession and during the COVID-19 pandemic, libraries are no strangers to the hard work, patience, and luck needed when it comes to budget planning and pushing publishers toward OA. But will libraries ever achieve the ultimate feat of bagging gold OA for all titles in all disciplines? Open access comes at a price; a gold sweep may not be possible as many institutions continue to struggle financially with the after-effects of the pandemic and lower enrollment figures. Libraries at institutions that have recovered financially, or where enrollment numbers continue to remain strong, are still nervously monitoring an economy that has, for the last two years, continuously threatened to slip into recession. And as more publishers successfully transition their revenue streams from annual or multiyear subscriptions to transformative OA agreements, some librarians wonder if academia will remain locked in a “different lipstick, same pig” model that does nothing to fundamentally change the way scholarly communications is dominated by a few large publishers.
|
AVERAGE 2023 PRICE FOR SCIENTIFIC DISCIPLINES |
|
| DISCIPLINE | AVERAGE PRICE PER TITLE |
| Chemistry | $7,276 |
| Physics | 5,881 |
| Engineering | 4,911 |
| Biology | 4,430 |
| Food Science | 4,178 |
| Geology | 3,806 |
| Technology | 3,725 |
| Botany | 2,957 |
| Zoology | 2,940 |
| Geography | 2,805 |
| Health Sciences | 2,752 |
| Agriculture | 2,634 |
| Astronomy | 2,582 |
| General Science | 2,581 |
| Math & Computer Science | 2,435 |
|
SOURCE: LJ PERIODICALS PRICE SURVEY 2023 |
|
FINISHING STRONG: THE ECONOMY
Nationally, unemployment remained low and economic performance stayed strong through the end of 2022. According to the Bureau of Economic Analysis, the U.S. real gross domestic product increased 2.1 percent in 2022, compared with an uptick of 5.9 percent in 2021. In January 2023, the Consumer Price Index for All Urban Consumers decreased 0.5 percent, seasonally adjusted, and rose 6.4 percent over the last 12 months, not seasonally adjusted. At the state level, enacted budgets for FY23 provide for general-fund spending of $1.16 trillion, a 6.7 percent increase over FY22—when states recorded spending growth of 18.3 percent, the highest annual increase in spending recorded in the Fiscal Survey of States since its inception in 1979. Adjusted for inflation, general-fund spending in FY22 increased 9.6 percent, the highest annual increase in more than 40 years. Even after adjusting for inflation, it is estimated that spending in fiscal 2023 will increase by 7.0 percent. Virtually all states reported that FY22 general-fund revenue collections are exceeding original budget forecasts.
|
COST HISTORY FOR TITLES IN SCOPUS |
|||||||
| SUBJECT | AVERAGE NO. OF TITLES 2021-23 |
CHANGE IN NUMBER OF TITLES |
AVERAGE COST PER TITLE 2021 |
AVERAGE COST PER TITLE 2022 |
% OF CHANGE 2022 | AVERAGE COST PER TITLE 2023 |
% OF CHANGE 2023 |
| Business & Economics | 1,905 | -41 | $1,799 | $1,782 | -1 | $1,863 | 5 |
| Fine Arts | 408 | 2 | 562 | 581 | 3 | 612 | 5 |
| Health Sciences | 4,583 | -197 | 1,670 | 1,747 | 5 | 1,836 | 5 |
| Humanities | 2,925 | -34 | 523 | 543 | 4 | 570 | 5 |
| Law | 394 | -15 | 716 | 736 | 3 | 765 | 4 |
| Life Sciences | 2,494 | -118 | 2,407 | 2,491 | 4 | 2,606 | 5 |
| Social Sciences | 3,582 | -72 | 1,129 | 1,166 | 3 | 1,235 | 6 |
| STEM | 6,075 | -102 | 2,584 | 2,688 | 4 | 2,828 | 5 |
| TOTAL/AVERAGE | 22,366 | -577 | 1,737 | 1,799 | 4 | 1,890 | 5 |
|
SOURCE: LJ PERIODICALS PRICE SURVEY 2023 |
|||||||
Still, throughout 2022, interest and inflation rates not seen since 1982 threatened to tip the U.S. economy into recession. Internationally, the war in Ukraine, the resulting European energy crisis, and slowing growth in China also loomed over an otherwise resilient economy. Although the start of this year saw a wave of layoffs announced as companies reacted to lower revenues and concerns about a slowing economy, the domestic employment market remained tight, with the number of job openings continuing to outpace the number of people looking for work. And while most states now have sufficient rainy-day funds to offset a mild recession, many may opt to cut spending instead.
BACK OF THE PACK: HIGHER EDUCATION
By the end of 2022, America’s higher-education workforce had largely returned to its pre-pandemic size. Continued federal stimulus and relief funding reduced states’ needs to trim academic funding. However, many institutions continue to battle the headwinds of declining enrollment, the inflationary effects of a strong economy, and the end of federal COVID relief.
|
COST HISTORY FOR ONLINE TITLES IN CLARIVATE |
||||||
| SUBJECT | AVERAGE NO. OF TITLES 2021-23 |
AVERAGE COST PER TITLE 2021 |
AVERAGE COST PER TITLE 2022 |
% OF CHANGE 2021-22 | AVERAGE COST PER TITLE 2023 |
% OF CHANGE 2022-23 |
| Agriculture | 77 | $1,360 | $1,399 | 3 | $1,432 | 2 |
| Anthropology | 40 | 601 | 624 | 4 | 644 | 3 |
| Arts & Architecture | 90 | 483 | 501 | 4 | 530 | 6 |
| Astronomy | 13 | 2,104 | 2,164 | 3 | 2,239 | 3 |
| Biology | 187 | 3,154 | 3,275 | 4 | 3,360 | 3 |
| Botany | 24 | 2,346 | 2,412 | 3 | 2,463 | 2 |
| Business & Economics | 378 | 1,987 | 1,969 | -1 | 2,049 | 4 |
| Chemistry | 74 | 5,737 | 5,974 | 4 | 6,227 | 4 |
| Education | 136 | 1,214 | 1,274 | 5 | 1,340 | 5 |
| Engineering | 192 | 2,687 | 2,793 | 4 | 2,906 | 4 |
| Food Science | 15 | 3,068 | 2,895 | -6 | 3,040 | 5 |
| General Science | 40 | 1,573 | 1,642 | 4 | 1,705 | 4 |
| General Works | 55 | 276 | 282 | 2 | 292 | 3 |
| Geography | 60 | 1,711 | 1,789 | 5 | 1,865 | 4 |
| Health Sciences | 534 | 2,055 | 2,129 | 4 | 2,196 | 3 |
| History | 289 | 525 | 547 | 4 | 565 | 3 |
| Language & Literature | 406 | 431 | 450 | 4 | 471 | 5 |
| Law | 87 | 496 | 538 | 9 | 552 | 3 |
| Library Science | 31 | 704 | 720 | 2 | 741 | 3 |
| Math & Computer Science | 103 | 1,799 | 1,856 | 3 | 1,926 | 4 |
| Military & Naval Science | 10 | 1,215 | 1,263 | 4 | 1,324 | 5 |
| Music | 51 | 365 | 375 | 3 | 384 | 2 |
| Philosophy & Religion | 191 | 440 | 469 | 7 | 485 | 3 |
| Physics | 96 | 4,586 | 4,760 | 4 | 4,953 | 4 |
| Political Science | 88 | 966 | 1,007 | 4 | 1,051 | 4 |
| Psychology | 111 | 1,136 | 1,189 | 5 | 1,240 | 4 |
| Recreation | 38 | 942 | 991 | 5 | 1,049 | 6 |
| Social Sciences | 45 | 1,029 | 1,088 | 6 | 1,129 | 4 |
| Sociology | 255 | 1,110 | 1,145 | 3 | 1,203 | 5 |
| Technology | 45 | 2,601 | 2,594 | 0 | 2,729 | 5 |
| Zoology | 63 | 2,735 | 2,803 | 3 | 2,840 | 1 |
| TOTALS | 3858 | 1,575 | 1,624 | 3 | 1,684 | 4 |
|
SOURCE: LJ PERIODICALS PRICE SURVEY 2023 |
||||||
According to the Chronicle of Higher Education, colleges lost nearly 1.3 million students during the pandemic, particularly in areas with larger low-income and minority populations—groups higher-education institutions have historically lagged in admitting. The National Center for Education Statistics reports that the rate of high school completers immediately enrolling in college in 2020 was 63 percent, a decrease from 68 percent in 2010. A tight labor market, particularly in skilled trades, means that many are questioning the value of a college education, putting further pressure on institutions—particularly small privates and mid-tier publics—to cut tuition or programs to boost enrollment and control costs. The labor market has also made hiring more difficult and more expensive for the many institutions that have seen longtime library employees retire or resign. Of equal or perhaps greater concern: The average return for all college endowments in FY22 plummeted to negative 8 percent, according to the National Association of College and University Business Officers.
The situation is not much better in the public sector. The Public Library Association’s 2021 Public Library Staff and Diversity Report noted that 27 percent of responding libraries lost staff positions in the past 12 months. Similarly, while respondents to Library Journal’s 2023 U.S. Public Library Budget Survey reported an average budget increase of 6.1 percent, that increase still falls short of last year’s 6.4 percent inflation rate.
TOP OF THE PODIUM: TRADITIONAL PUBLISHERS
Traditional publishers remain at the forefront of open access and of publishing more generally. (Consulting firm Delta Think notes that half of total scholarly output is now published by just 10 publishers, each of whom publishes 400 or more journals.) These publishers are continuing to expand offerings that both support OA and provide additional revenue streams that complement traditional publishing revenue. Wiley subsidiary Knowledge Unlatched, for example, this year began migrating Wiley customers to OABLE, its OA workflow-management solution. Elsevier reorganized to better position itself as an OA leader and last year established a joint pilot to make selected articles from the American Chemical Society, Wiley, Taylor & Francis, and the Royal Society of Chemistry discoverable through its ScienceDirect platform. Taylor & Francis began offering institutions open access memberships, which offer discounts on article processing charges (APCs) and more predictable pricing than transformative agreements with no APC limits.
Springer Nature, still the dominant OA publisher, continued to develop products that not only support but integrate the research life cycle into the Springer Nature ecosystem. Its subsidiary American Journal Experts is making its AI-driven editing services freely available to book authors and editors, while the newly acquired TooWrite platform aims to assist researchers in creating journal papers and doctoral theses. It also launched Nature Research Intelligence, a new AI-led service to help research decision makers. Authors submitting to a number of Springer Nature journals will now be able to easily opt into data sharing, via Figshare, as part of one integrated submission process.
|
COST HISTORY FOR TITLES INDEXED IN ACADEMIC |
|||||||
| SUBJECT | AVERAGE NO. OF TITLES 2021-23 |
CHANGE FROM PER TITLE 2021-23 |
AVERAGE COST PER TITLE 2021 |
AVERAGE COST PER TITLE 2022 |
% OF CHANGE 2021-22 | AVERAGE COST PER TITLE 2023 |
% OF CHANGE 2023 |
| Agriculture | 158 | -8 | $1,784 | $1,871 | 5 | $1,956 | 5 |
| Anthropology | 46 | -8 | 824 | 851 | 3 | 893 | 5 |
| Arts & Architecture | 56 | -1 | 614 | 639 | 4 | 695 | 9 |
| Astronomy | 25 | -1 | 1,102 | 1,113 | 1 | 1,158 | 4 |
| Biology | 401 | -28 | 3,570 | 3,693 | 3 | 3,801 | 3 |
| Botany | 55 | -1 | 1,849 | 1,894 | 2 | 1,891 | 0 |
| Business & Economics | 224 | -5 | 1,256 | 1,296 | 3 | 1,376 | 6 |
| Chemistry | 152 | -4 | 6,221 | 6,480 | 4 | 6,768 | 4 |
| Education | 247 | -12 | 1,138 | 1,182 | 4 | 1,259 | 6 |
| Engineering | 574 | -12 | 3,380 | 3,535 | 5 | 3,758 | 6 |
| Food Science | 34 | -1 | 2,122 | 2,199 | 4 | 2,355 | 7 |
| General Science | 72 | -4 | 1,950 | 2,009 | 3 | 2,146 | 7 |
| General Works | 91 | -5 | 328 | 348 | 6 | 345 | -1 |
| Geography | 88 | -4 | 1,833 | 1,901 | 4 | 1,972 | 4 |
| Geology | 69 | -4 | 3,076 | 3,200 | 4 | 3,337 | 4 |
| Health Sciences | 1,117 | -62 | 1,922 | 2,016 | 5 | 2,129 | 6 |
| History | 377 | -13 | 550 | 570 | 4 | 601 | 5 |
| Language & Literature | 319 | -10 | 547 | 573 | 5 | 609 | 6 |
| Law | 238 | 11 | 372 | 417 | 12 | 438 | 5 |
| Library Science | 76 | -1 | 817 | 840 | 3 | 886 | 6 |
| Math & Computer Science | 255 | -8 | 2,378 | 2,472 | 4 | 2,595 | 5 |
| Military & Naval Science | 40 | 4 | 679 | 705 | 4 | 756 | 7 |
| Music | 87 | -2 | 255 | 264 | 4 | 274 | 4 |
| Philosophy & Religion | 316 | -4 | 377 | 396 | 5 | 416 | 5 |
| Physics | 172 | -9 | 4,667 | 4,810 | 3 | 5,003 | 4 |
| Political Science | 109 | -4 | 884 | 924 | 4 | 983 | 6 |
| Psychology | 163 | -8 | 1,140 | 1,200 | 5 | 1,281 | 7 |
| Recreation | 37 | -1 | 1,042 | 1,100 | 6 | 1,187 | 8 |
| Social Sciences | 46 | -2 | 1,021 | 1,071 | 5 | 1,138 | 6 |
| Sociology | 333 | -14 | 1,165 | 1,212 | 4 | 1,303 | 7 |
| Technology | 62 | -4 | 2,417 | 2,459 | 2 | 2,624 | 7 |
| Zoology | 111 | -5 | 1,661 | 1,709 | 3 | 1,732 | 1 |
| TOTALS | 6,150 | -230 | 1,841 | 1,918 | 4 | 2,016 | 5 |
|
SOURCE: LJ PERIODICALS PRICE SURVEY 2023 |
|||||||
GOLD OA: STILL EVERYONE’S HERO?
Librarians and researchers are finally seeing the goals of OA mandates come to fruition en masse as transformative agreements become commonplace. Commercial publishers will undoubtedly continue to pivot sales and pricing strategies to what so far remains a profitable publishing model; market-research company Simba Information predicts that revenue from OA journals will represent 22 percent of all journal revenue by 2026. Still, as big deals become nostalgia and publishers focus their efforts on transformative agreements, many librarians remain frustrated with opaque pricing structures. cOAlition S’s newly launched Journal Comparison Service, where publishers can register and deposit price and service data, may appease those whose main argument against high profits in scholarly communications is the lack of transparency surrounding the actual publishing costs. (Two of the biggest publishers, Elsevier and Springer Nature, have so far declined to participate, and it’s unclear if pricing transparency will have any effect on where researchers choose to publish.)
The big question is what effect the White House Office of Science and Technology Policy’s (OSTP) August 2022 announcement, which recommended that federal agencies make the results of taxpayer-supported research publicly accessible by 2026, will have on the OA business model generally. Unlike cOAlition S’s 2018 Plan S initiative, the OSTP memo does not prescribe any particular business model, so the most profitable path will probably drive how public access is made available. For large publishers, gold OA seems to offer a source of sustainable revenue. Smaller publishers may also determine that they need to shift to gold OA to survive, even though many journals are not currently sustainable under APC models. Institutions that publish may feel further squeezed if gold OA becomes the dominant model, and may eventually need to scale back what they are willing to pay for.
|
2024 COST PROJECTIONS FOR TITLES INDEXED |
||||||
| MASTERFILE PREMIER | NO. OF TITLES 2021-23 |
AVERAGE COST PER TITLE 2021 |
AVERAGE COST PER TITLE 2022 |
% OF CHANGE 2021-22 | AVERAGE COST PER TITLE 2023 |
% OF CHANGE 2023 |
| U.S. | 872 | $345 | $364 | 5.4 | $386 | 6.1 |
| Non-U.S. | 202 | $482 | $514 | 6.7 | $549 | 6.9 |
|
SOURCE: LJ PERIODICALS PRICE SURVEY 2023 |
||||||
|
2024 COST PROJECTIONS FOR TITLES |
||||||||
| ACADEMIC SEARCH PREMIER | NO. OF TITLES |
% OF LIST | 2023 AVERAGE COST PER TITLE |
% OF COST | PROJECTED % OF INCREASE |
PROJECTED 2024 AVERAGE COST PER TITLE |
% OF COST | PROJECTED OVERALL % INCREASE* |
| U.S. | 2,414 | 39 | $1,588 | 31 | 5.5 | $1,675 | 31 | 5.1 |
| Non-U.S. | 3,736 | 61 | $2,293 | 69 | 4.9 | $2,406 | 69 | |
|
*Column overall increase is inclusive of foreign and U.S. SOURCE: LJ PERIODICALS PRICE SURVEY 2023 |
||||||||
Whether the gold OA model will ever be sustainable remains questionable. To date, the market has not provided any other OA solution that meets the discoverability, exposure, and publishing possibilities that libraries and researchers have enjoyed with subscription models. MIT’s new shift+OPEN initiative to flip subscription-based journals to diamond open access is encouraging, but it is still reliant on external funding. OA boosters can hope that, in time, the OSTP memo may provide a path toward sustainable OA, be it gold or another model. Similarly, the new cOAlition S initiative to explore how a globally fair pricing system for academic publishing could be devised and implemented offers hope that OA publishing will eventually result in a payment system that is fair, equitable, and transparent.
THE 2024 FORECAST
The 2024 serials marketplace will see all players in the information marketplace continue to exert themselves as they collectively push scholarly communications toward gold OA. The 4 percent price increase seen in 2023 is expected to tick up by 5 to 5.5 percent for 2024. Whether this year’s higher increase represents publishers’ actual inflationary costs after two years of very low increases, or simply a return to an annual increase that publishers feel libraries will accept, is unclear.
For comparison purposes, the rate of price increase is also analyzed for 7,144 e-journal packages handled by EBSCO Information Services. Packages are a large part of the periodicals marketplace, so the rate of price increase for these is important data. For 2022, the average rate of increase was 3.76 percent, compared to 2.12 percent in 2021 and 4.3 percent in 2020. The Read & Publish packages processed by EBSCO Information Services show a slightly lower average price increase of 2.83 percent. Although the data set for Read & Publish packages is still quite small (223 packages), it suggests that the industry is pricing these bundles more aggressively as an incentive to move to a Read & Publish model. For librarians hoping to do a victory lap with gold in hand, this could be cheering news.
Still, even with researchers cheering each announcement of another transformative agreement, how long library budgets can keep pace with publisher offerings remains to be seen. Open-access pricing models are still largely transitional in nature, and a model has yet to emerge that will prove itself to be sustainable, at least for libraries. Librarians will still be sweating this year’s slightly higher increase.
The Value of Journals
Journal price data is important for budget-management processes, but price alone is not the sole factor determining value. Metrics such as Impact Factor are important in assessing value, and similar metrics will only increase in importance in the future. Improvements in usage-data gathering (COUNTER 5) may provide more data that could be used to help make qualitative assessments of scholarly publishing. Data-based decisions will be very important in determining values as libraries actively manage their information resources.
|
COMPARISON OF AVERAGE PRICE OF TITLES IN |
|||||||
| PRICE BAND | NO. OF TITLES |
AVERAGE PRICE 2023 | % PRICE CHANGE 2022-23 | AVERAGE COST OF LATEST IMPACT FACTOR | NORMALIZED EIGEN-FACTOR | AVERAGE COST PER CITATION | |
| Less than $646 | 4,344 | $197 | -19.6 | 3.60 | 1.5036 | $0.03 | |
| Between $646 and $1,275 | 2,852 | 936 | 4.9 | 2.97 | 0.6803 | 0.26 | |
| Between $1276 and $2,177 | 2,408 | 1,676 | 5.7 | 3.64 | 1.1902 | 0.27 | |
| Between $2178 and $4,546 | 2,326 | 3,123 | 5.3 | 4.39 | 1.9812 | 0.28 | |
| Greater than $4,546 | 1,775 | 8,791 | 5.0 | 4.65 | 3.1668 | 0.44 | |
|
SOURCE: LJ PERIODICALS PRICE SURVEY 2023 |
|||||||
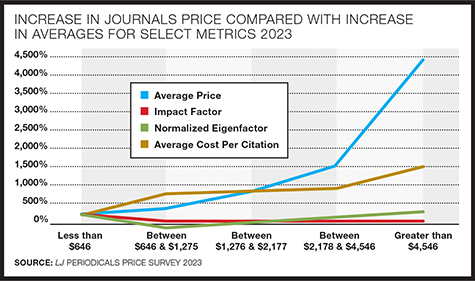
There are flaws in the Impact Factor, but nothing has arisen to replace it. This year, the survey continues to work with pricing data collected for this article to explore the relationship between prices and metrics such as Impact Factor, Eigenfactor, and Article Influence Score. The relationship between serial prices and citations was explored, with interesting results.
To examine the relationship between price and value, the titles in the Scopus index were combined with data from the Clarivate and EBSCO indexes for 2023 and were then divided into broad price categories. The selection of categories was based on median prices with standard deviations, and those price bands remain in use for comparison. The average for Impact Factor and Eigenfactor, for all titles in a price range, was compared with the averages in the other price bands. The results are displayed in “Cost History for Titles in Clarivate Analytics Indexes by Library of Congress Subject,” below. All value metrics tended to increase with the increase in price. However, this increase was significantly less than the increase in price.
|
COST HISTORY FOR TITLES IN CLARIVATE ANALYTICS |
|||||||
| SUBJECT | AVERAGE NO. OF TITLES 2021-23 |
CHANGE FROM PER TITLE 2021-23 |
AVERAGE COST PER TITLE 2021 |
AVERAGE COST PER TITLE 2022 |
% OF CHANGE 2021-22 | AVERAGE COST PER TITLE 2023 |
% OF CHANGE 2023 |
| Agriculture | 106 | -4 | $2,409 | $2,528 | 5 | $2,634 | 4 |
| Anthropology | 40 | -5 | 769 | 776 | 1 | 800 | 3 |
| Arts & Architecture | 93 | -1 | 565 | 592 | 5 | 632 | 7 |
| Astronomy | 13 | -1 | 2,417 | 2,484 | 3 | 2,582 | 4 |
| Biology | 358 | -19 | 4,171 | 4,323 | 4 | 4,430 | 2 |
| Botany | 30 | 0 | 2,933 | 2,994 | 2 | 2,957 | -1 |
| Business & Economics | 2,957 | -17 | 2,169 | 2,172 | 0 | 2,276 | 5 |
| Chemistry | 142 | 1 | 6,703 | 6,986 | 4 | 7,276 | 4 |
| Education | 155 | -6 | 1,386 | 1,460 | 5 | 1,560 | 7 |
| Engineering | 314 | -6 | 4,394 | 4,638 | 6 | 4,911 | 6 |
| Food Science | 19 | -1 | 3,886 | 3,901 | 0 | 4,178 | 7 |
| General Science | 50 | -3 | 2,327 | 2,428 | 4 | 2,581 | 6 |
| General Works | 65 | -3 | 306 | 315 | 3 | 338 | 8 |
| Geography | 81 | -2 | 2,589 | 2,711 | 5 | 2,805 | 3 |
| Geology | 56 | -2 | 3,499 | 3,655 | 4 | 3,806 | 4 |
| Health Sciences | 949 | -31 | 2,481 | 2,612 | 5 | 2,752 | 5 |
| History | 322 | -8 | 575 | 598 | 4 | 628 | 5 |
| Language & Literature | 435 | -7 | 512 | 534 | 4 | 566 | 6 |
| Law | 98 | -3 | 505 | 562 | 11 | 582 | 4 |
| Library Science | 40 | -1 | 1,046 | 1,095 | 5 | 1,160 | 6 |
| Math & Computer Science | 136 | -6 | 2,283 | 2,347 | 3 | 2,435 | 4 |
| Military & Naval Science | 13 | 0 | 1,286 | 1,359 | 6 | 1,438 | 6 |
| Music | 54 | -2 | 405 | 419 | 4 | 438 | 5 |
| Philosophy & Religion | 196 | -4 | 479 | 501 | 5 | 526 | 5 |
| Physics | 147 | -3 | 5,476 | 5,658 | 3 | 5,881 | 4 |
| Political Science | 90 | -4 | 1,153 | 1,215 | 5 | 1,301 | 7 |
| Psychology | 149 | -1 | 1,342 | 1,409 | 5 | 1,506 | 7 |
| Recreation | 41 | 0 | 1,070 | 1,137 | 6 | 1,226 | 8 |
| Social Sciences | 58 | -1 | 1,155 | 1,205 | 4 | 1,272 | 6 |
| Sociology | 283 | -9 | 1,336 | 1,390 | 4 | 1,498 | 8 |
| Technology | 56 | -2 | 3,463 | 3,488 | 1 | 3,725 | 7 |
| Zoology | 69 | -1 | 2,807 | 2,915 | 4 | 2,940 | 1 |
| TOTALS | 5166 | -152 | 2,226 | 2,315 | 4 | 2,425 | 5 |
|
SOURCE: LJ PERIODICALS PRICE SURVEY 2023 |
|||||||
Although there were increases in the metrics for Impact Factor and Eigenfactor, the increases were not comparable to the increase in price. The average annual price ($8,791) for the most expensive journals was 44 times higher than the least expensive ($197), while the Impact Factor increased only 77 percent from the least to the most expensive titles. We are also seeing the impact of Open Access, as the cost for the cheapest titles decreased while the Impact Factor increased as more journals moved to OA. The price increases for the more moderately priced titles were consistent with the more expensive titles, which showed close to a 5 percent increase. This analysis continues to show that higher-priced titles have higher Impact Factors and Eigenfactors, but the increase in the metrics is small when compared with the huge increase in subscription costs.
The ratio of citations to serial costs by subject is reviewed in “2024 Cost Projections by Broad Subject,” below. For science, technology, and medicine (STM) journals, average prices tend to be high in comparison with other subjects. This scenario changes if the costs are divided by the numbers of citations. Chemistry has the highest average price among subject disciplines, but the eighth-lowest cost per citation. If citations are considered an indicator of value, then chemistry journals, despite high average prices, are high-value journals. Conversely, journals in philosophy, music, and history are relatively cheap but infrequently cited, so journals in those areas show the highest cost per citation.
|
2024 COST PROJECTIONS BY BROAD SUBJECT |
|||||||||
| NO. OF TITLES |
% OF LIST | 2023 COST | % OF COST | AVERAGE COST PER TITLE | PROJECTED % OF INCREASE | PROJECTED 2024 COST | % OF COST | PROJECTED OVERALL % INCREASE | |
|
ARTS AND HUMANITIES CITATION INDEX |
|||||||||
| U.S. | 401 | 34 | $121,476 | 19 | $303 | 6.3 | $129,189 | 19 | 5.3 |
| Non-U.S. | 796 | 66 | 521,679 | 81 | 655 | 5.1 | 548,051 | 81 | |
|
SOCIAL SCIENCES CITATION INDEX |
|||||||||
| U.S. | 774 | 41 | 903,363 | 29 | 1,167 | 6.7 | 964,163 | 29 | 6.0 |
| Non-U.S. | 1,097 | 59 | 2,217,380 | 71 | 2,021 | 5.7 | 2,344,342 | 71 | |
|
SCIENCE CITATION INDEX |
|||||||||
| U.S. | 917 | 44 | 3,223,493 | 37 | 3,515 | 4.7 | 3,374,294 | 37 | 4.9 |
| Non-U.S. | 1,181 | 56 | 5,539,793 | 63 | 4,691 | 5.1 | 5,819,840 | 63 | |
|
PROJECTED OVERALL INCREASE FOR ALL TITLES IN CLARIVATE ANALYTIC INDEXES: 5.2% |
|||||||||
|
SOURCE: LJ PERIODICALS PRICE SURVEY 2023 |
|||||||||
It is not surprising that commercial publishers have higher per-citation costs than other types of publishers. Commercial publishers showed a cost per citation of 32¢ and an average price of $2,405, while university presses showed 11¢ and an average price of $799, and societal publishers showed 7¢ and an average price of $1,657.
|
COMPARISON OF SERIALS PRICES WITH RATES |
|||||
| SUBJECT | NO. OF TITLES |
TOTAL COST | TOTAL CITATIONS | COST PER CITE | AVERAGE OA GOLD |
| General Science | 197 | $394,060 | 5,942,164 | $0.07 | 19% |
| Astronomy | 63 | 150,616 | 1,036,534 | 0.15 | 20 |
| Health Sciences | 3,387 | 6,369,916 | 32,236,401 | 0.20 | 21 |
| Biology | 1,285 | 3,580,198 | 17,722,560 | 0.20 | 26 |
| Psychology | 302 | 368,253 | 1,707,912 | 0.22 | 13 |
| Botany | 167 | 348,436 | 1,540,700 | 0.23 | 21 |
| Agriculture | 418 | 713,228 | 2,839,023 | 0.25 | 22 |
| Food Science | 68 | 205,180 | 804,179 | 0.26 | 15 |
| Engineering | 1,422 | 4,724,128 | 17,776,070 | 0.27 | 13 |
| Geography | 272 | 461,525 | 1,725,945 | 0.27 | 22 |
| Chemistry | 450 | 2,281,789 | 8,461,790 | 0.27 | 14 |
| Geology | 236 | 534,359 | 1,845,682 | 0.29 | 17 |
| Recreation | 91 | 98,708 | 309,105 | 0.32 | 8 |
| Technology | 241 | 722,280 | 2,099,194 | 0.34 | 15 |
| Physics | 468 | 2,103,100 | 5,839,995 | 0.36 | 19 |
| Sociology | 644 | 839,797 | 2,132,258 | 0.39 | 15 |
| Business & Economics | 1,088 | 2,205,155 | 5,522,969 | 0.40 | 14 |
| Political Science | 232 | 248,279 | 562,260 | 0.44 | 18 |
| General Works | 15 | 13,847 | 30,795 | 0.45 | 20 |
| Library Science | 65 | 71,322 | 152,085 | 0.47 | 11 |
| Zoology | 270 | 589,757 | 1,225,485 | 0.48 | 19 |
| Social Sciences | 126 | 155,135 | 310,951 | 0.50 | 18 |
| Math & Computer Science | 773 | 1,817,795 | 3,191,679 | 0.57 | 13 |
| Education | 344 | 493,494 | 862,222 | 0.57 | 12 |
| Language & Literature | 367 | 292,043 | 487,401 | 0.60 | 14 |
| Anthropology | 79 | 84,065 | 139,399 | 0.60 | 15 |
| Arts & Architecture | 35 | 49,909 | 77,540 | 0.64 | 12 |
| Law | 203 | 136,781 | 210,422 | 0.65 | 14 |
| Military & Naval Science | 37 | 50,559 | 68,565 | 0.74 | 21 |
| Music | 21 | 17,941 | 22,020 | 0.81 | 12 |
| History | 279 | 243,278 | 266,239 | 0.91 | 13 |
| Philosophy & Religion | 63 | 64,738 | 66,336 | 0.98 | 16 |
| TOTALS | 13,708 | 30,429,672 | 117,215,880 | 0.26 | 16 |
|
SOURCE: LJ PERIODICALS PRICE SURVEY 2023 |
|||||
METHODOLOGY
Survey tables are created by examining historical serials-pricing information from EBSCO Information Services for serial titles indexed in Scopus, Clarivate Analytics Citation Indexes, EBSCOhost Academic Search Ultimate, and/or EBSCOhost MasterFILE Complete. Data for impact factor and other citation-based metrics is derived from Clarivate’s Journal Citation Reports (JCR).
Except for Tables 2 and 3, the price survey uses a print-preferred pricing model based on the standard retail price for the titles in the selected indexes. Print pricing is used for consistency because not all publishers make their online-only pricing available, or they do not have a standard online-only retail price. The index contains pricing for print + online and online only if those were the only rates offered. The majority of pricing now has online components, and print only has dropped to 35 percent of the available pricing.
This year, the percentage of gold OA articles was also included in Table 5, which compares serial prices for titles indexed in Scopus with the number of citations to produce an average cost per cite for that discipline. Comparing the percentage of OA gold articles
against publisher type showed that approximately 18 percent of articles from commercial publishers were gold OA, compared with 18 percent for university presses and 13 percent for society publishers.
It will be interesting to see if the percentage of gold OA articles available across publisher types and subject areas evens out over time, or if an inequity develops—such as in subject areas in which external funding for dissemination of research work has historically been nonexistent or more difficult to find.
Stephen Bosch is Materials Budget, Procurement, and Licensing Librarian Emeritus, University of Arizona Library, Tucson. Siôn Romaine is Director of Acquisitions & Rapid Cataloging Services at the University of Washington Libraries. Barbara Albee is Account Services Manager, EBSCO Information Services. Cynthia M. Elliott is Collection Management Librarian, University of Arizona Library, Tucson.

Added To Cart
RELATED


RECOMMENDED


TECHNOLOGY

ALREADY A SUBSCRIBER? LOG IN
We are currently offering this content for free. Sign up now to activate your personal profile, where you can save articles for future viewing
ALREADY A SUBSCRIBER? LOG IN
Thank you for visiting.
We’ve noticed you are using a private browser. To continue, please log in or create an account.

Add Comment :-
Comment Policy:
Comment should not be empty !!!