


2018 School Spending Survey Report
Holding Steady | Placements and Salaries Survey 2022
Although lacking 2022’s dramatic job market gains, this year’s Placements and Salaries survey demonstrated a hard-won stability.
Although lacking 2022’s dramatic job market gains, this year’s Placements and Salaries survey demonstrated a hard-won stability
For the past three years, Library Journal’s Placements and Salaries survey has offered a snapshot of COVID-19’s impact on the library field. Graduates of library and information science (LIS) programs in 2020 emerged with their diplomas into a highly disrupted industry, contending with library shutdowns, layoffs and furloughs, rescinded job offers, and fears for their safety. As shown in last year’s survey, however, 2021 graduates were met with a recovering economy, a national vaccine program and improved personal protection measures, and a growing—although far from perfect—awareness of the need for more equity in the workplace. Starting salaries jumped by 7.9 percent, and the numbers of employed graduates with full-time positions returned to 2019 highs of 86 percent.
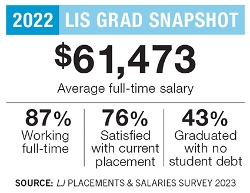
The 2023 Placements and Salaries survey, by comparison, showed only incremental improvements. The average full-time starting salary for 2022 grads was $61,473, up only about $500 from last year. Unemployment was down to 5 percent from 7 percent in 2022, and of those who are employed, 87 percent hold full-time positions. (It should also be noted that participation, with 1,256 people responding to the survey, was slightly down this year.)
But while not cause for bold-type headlines, 2023 survey results speak to a level of stability in a field that has seen more than its share of hardships. For recent graduates, these numbers represent a welcome development in still-uncertain times.
|
STATUS OF 2022 GRADUATES* |
|||||||
| SCHOOL REGION | NUMBER OF SCHOOLS REPORTING | NUMBER OF GRADUATES | EMPLOYED IN LIS FIELD | EMPLOYED OUTSIDE OF LIS | CURRENTLY UNEMPLOYED OR CONTINUING EDUCATION | TOTAL ANSWERING | % EMPLOYED FULL-TIME* |
| Midwest | 11 | 1,398 | 226 | 164 | 22 | 412 | 90% |
| Northeast | 7 | 839 | 164 | 13 | 7 | 184 | 84% |
| South Central | 7 | 1,133 | 181 | 26 | 9 | 216 | 90% |
| Southeast | 6 | 683 | 175 | 15 | 15 | 205 | 90% |
| West (Pacific/ Mountain) | 6 | 1,222 | 199 | 27 | 13 | 239 | 78% |
| TOTAL | 37 | 5,275 | 945 | 245 | 66 | 1,256 | 87% |
|
*IF CURRENTLY EMPLOYED |
|||||||
THE CLASS OF 2022
This year’s poll saw responses from graduates from 37 U.S.-based, American Library Association (ALA)–accredited institutions, up from last year’s 35. All offered some variant of an MLIS (Master of Library and Information Science) degree, including information science, data science, school media specialty, bio/health informatics and other related degrees. The best-represented schools included the University of Michigan, with 183 respondents; another 155 earned their master’s degrees from San José University.
|
PLACEMENTS & FULL-TIME SALARIES OF 2022 GRADUATES BY REGION |
||||||
|
AVERAGE SALARY |
||||||
| REGION | NUMBER OF PLACEMENTS | Women | Men | Nonbinary* | All | DIFFERENCE IN AVERAGE M/F SALARY |
| Midwest | 221 | $54,608 | $64,680 | $49,634 | $56,665 | -15.6% |
| Mountain | 45 | 52,727 | 59,575 | 58,000 | 54,447 | -11.5% |
| Northeast | 185 | 61,802 | 60,883 | 57,896 | 61,110 | 1.5% |
| Pacific | 121 | 75,644 | 71,069 | 71,701 | 74,320 | 6.4% |
| South Central | 128 | 49,204 | 51,635 | 47,340 | 49,333 | -4.7% |
| Southeast | 170 | 55,045 | 60,709 | 71,367 | 56,895 | -9.3% |
| International | 9 | 59,167 | 75,500 | - | 67,667 | -21.5% |
| Remote | 83 | 86,886 | 92,945 | 62,000 | 88,922 | -6.5% |
| TOTAL | 962 | 60,316 | 66,277 | 59,726 | 61,473 | -9.5% |
|
THIS TABLE REPRESENTS ONLY SALARIES REPORTED AS FULL-TIME. SOME DATA WERE REPORTED AS AGGREGATE WITHOUT BREAKDOWN BY GENDER OR REGION. COMPARISON WITH OTHER TABLES MAY SHOW DIFFERENT NUMBER OF PLACEMENTS. |
||||||
Gender distribution was virtually unchanged this year. As in the past several surveys, some three-quarters of 2022 graduates identified as women—74 percent, only slightly down from 75 percent in 2021. Eighteen percent identified as male, as in 2021. Six percent self-identified as nonbinary/gender nonconforming, versus 2021’s 5 percent, and 2 percent preferred not to disclose their gender, as in 2021. Results from the schools were consistent with the graduates’ individual responses.
Of these, nearly three-quarters—74 percent—were white. While certainly a majority, as it has been historically, this was significantly lower than 2021’s 84 percent. The 10 percent of respondents who were Asian (7 percent South Asian, 2 percent East Asian, and 1 percent Southeast Asian) represented a proportionally large increase from the class of 2021’s 4 percent. Similar to last year’s numbers, 8 percent were Hispanic or Latine, 4 percent Black or African American, 3 percent of mixed race, and 2 percent Native American or Indigenous; these findings were similar to 2022. Five percent preferred not to state their race.
 Their ages ranged widely, with the average age of 35 unchanged from last year. Twelve percent were 25 or under, 54 percent between 26 and 35, 19 percent between 36 and 45, 11 percent between 46 and 56, 4 percent 56 or older, and 1 percent preferred not to answer.
About half (53 percent) stated that library and information science was the first professional career that they pursued. This is slightly higher than the previous several years’ findings, where just under half were first-career librarians. Those who had changed fields had previous experience in disciplines including archaeology, the arts, business, communication, healthcare and medicine, information technology, journalism, law, marketing, psychology, publishing, retail, social work, and—most commonly—education, ranging from K–12 to higher ed.
The majority (91 percent) were not enrolled in another graduate or certificate concentration while completing their LIS degree. Among the 9 percent who were working toward dual degrees, certification in youth services was the most common. The majority (81 percent) did not have an advanced degree prior to starting their program. Most of the remaining 19 percent had degrees at the master’s level.
Most 2022 grads had a variety of experience working in libraries before they received their master’s—16 percent before entering their programs, 26 percent while earning their master’s, and 39 percent employed in libraries both before and during their academic programs. Although a slight majority stated that they felt their master’s degree changed their employment status for the better, most said they would “probably not” (54 percent) or “definitely not” (14 percent) be pursuing another advanced degree in the future. Twenty-six percent of participants said that they probably would, and 6 percent definitely plan to.
SUPPORT FROM SCHOOLS
Schools used a variety of methods for informing their graduates about job opportunities. By far, the most common were Listserv and email announcements. About half (51 percent) posted on social media accounts, and 46 percent shared job opening news through student groups and activities. Some schools offer formal placement services, 41 percent at the university level and 16 percent at the LIS school level. Over a quarter (27 percent) post job announcements on physical bulletin boards or in student areas.
In addition to letting degree earners know about existing opportunities, 22 percent of the institutions offered formal mentoring programs focused on professional development for graduates.
Fewer than half of the schools—44 percent—reported that starting salaries were about the same as the previous year’s. No school stated that they were lower, and 17 percent found that starting salaries increased since 2021 (39 percent were unsure of any increases or decreases). Full-time positions outnumbered part-time ones, 76 percent to 24 percent. Most responding schools (89 percent) found that it took 2022 grads about the same amount of time to find placements as they did in 2021.
|
AVERAGE SALARY FOR STARTING LIBRARY POSITIONS, 2013–22 |
||||
| YEAR | LIBRARY SCHOOLS REPRESENTED | AVG. Full-TIME STARTING SALARY | DIFFERENCE IN AVG. SALARY | PERCENTAGE CHANGE |
| 2013 | 40 | $45,650 | $1,147 | 2.58% |
| 2014 | 39 | $46,987 | $1,337 | 2.93% |
| 2015 | 39 | $48,371 | $1,384 | 2.95% |
| 2016 | 40 | $51,798 | $3,427 | 7.08% |
| 2017 | 41 | $52,152 | $354 | 0.68% |
| 2018 | 41 | $55,357 | $3,205 | 6.15% |
| 2019 | 36 | $58,655 | $3,298 | 5.96% |
| 2020 | 36 | $56,453 | ($2,202) | -3.75% |
| 2021 | 34 | $60,911 | $4,458 | 7.90% |
| 2022 | 37 | 61,473 | 562 | 0.92% |
|
SOURCE: LJ PLACEMENTS & SALARIES SURVEY 2023 |
||||
WHERE TO, AND HOW MUCH?
Most of the 2022 graduates have found employment. Nearly two-thirds (63 percent) reported working in a library or other information science institution. Thirteen percent were employed in an information science capacity but not in a library, and 19 percent worked outside the field. Among the unemployed, 60 percent were seeking work in the field (down from 2022’s 65 percent), 19 percent had enrolled in other degree programs, 15 percent were taking time off for personal reasons, 10 percent were interning, and 18 percent selected “other.” Perhaps the most significant indicator of pandemic-era rebound is that for the second year in a row, none listed being furloughed as a reason for unemployment.
|
PLACEMENTS BY FULL-TIME SALARY OF REPORTING 2022 GRADUATES* |
|||||
| SCHOOLS | TOTAL PLACEMENTS | AVERAGE SALARY | MEDIAN SALARY | LOW SALARY | HIGH SALARY |
| Alabama | 9 | $58,075 | $56,014 | $38,000 | $89,000 |
| Arizona | 8 | 71,696 | 55,250 | 42,000 | 198,000 |
| Buffalo | 12 | 56,317 | 58,000 | 39,500 | 75,000 |
| Catholic | 9 | 64,821 | 63,000 | 40,000 | 86,800 |
| Chicago State | 5 | 70,824 | 78,000 | 53,000 | 82,000 |
| Denver | 14 | 62,338 | 56,000 | 44,000 | 120,000 |
| Emporia State | 10 | 51,774 | 52,559 | 21,168 | 85,000 |
| Hawai‘i Mãnoa | 1 | - | - | - | - |
| Illinois Urbana-Champaign | 21 | 52,638 | 50,000 | 37,050 | 70,000 |
| Indiana Purdue | 19 | 51,900 | 47,000 | 30,160 | 100,000 |
| Kent State* | 14 | 45,845 | 43,515 | 24,000 | 84,000 |
| Kentucky | 17 | 48,197 | 45,534 | 27,000 | 106,000 |
| Louisiana State | 24 | 47,112 | 44,790 | 33,280 | 75,000 |
| Maryland | 15 | 59,646 | 58,500 | 38,000 | 78,000 |
| Michigan* | 78 | 102,191 | 97,500 | 32,000 | 200,000 |
| Missouri | 9 | 65,573 | 50,000 | 32,000 | 120,000 |
| NC Chapel Hill* | 17 | 60,245 | 62,400 | 20,400 | 90,000 |
| NC Greensboro | 33 | 52,742 | 50,000 | 31,200 | 103,500 |
| North Texas | 21 | 58,427 | 57,000 | 33,660 | 103,717 |
| Pittsburgh | 7 | 52,858 | 55,000 | 37,440 | 60,500 |
| Pratt | 12 | 60,703 | 62,250 | 48,000 | 77,000 |
| Queens | 15 | 65,980 | 60,570 | 44,000 | 130,000 |
| Rutgers | 25 | 61,195 | 58,000 | 38,500 | 120,000 |
| San José* | 52 | 64,314 | 60,500 | 30,000 | 155,000 |
| Simmons | 37 | 56,413 | 55,000 | 35,000 | 94,000 |
| South Carolina* | 11 | 45,909 | 45,000 | 29,000 | 58,000 |
| Southern California | 9 | 62,133 | 61,000 | 30,000 | 80,000 |
| Southern Mississippi | 35 | 48,733 | 48,000 | 21,600 | 92,000 |
| St. Catherine | 6 | 52,462 | 44,387 | 38,000 | 85,000 |
| St. John’s | 9 | 51,722 | 52,000 | 40,000 | 60,000 |
| Tennessee | 24 | 53,521 | 53,500 | 32,000 | 75,000 |
| Texas Women’s | 12 | 57,358 | 55,150 | 37,000 | 88,000 |
| Valdosta | 30 | 55,268 | 50,500 | 26,000 | 120,000 |
| Washington | 22 | 59,114 | 60,000 | 20,000 | 75,000 |
| Wayne State | 19 | 53,988 | 48,535 | 24,960 | 146,000 |
| Wisconsin Madison | 15 | 58,561 | 54,000 | 45,760 | 72,000 |
| Wisconsin Milwaukee | 17 | 49,670 | 48,000 | 34,000 | 67,000 |
| TOTAL | 693 | 61,473 | 56,000 | 20,000 | 200,000 |
|
THIS TABLE REPRESENTS PLACEMENTS AND SALARIES REPORTED AS FULL-TIME. SOME INDIVIDUALS OR SCHOOLS OMITTED INFORMATION, RENDERING INFORMATION UNUSABLE. |
|||||
Of the 87 percent of graduates with full-time jobs, a significant majority (92 percent) of those positions are permanent. Part-time employees hold an average of 1.4 jobs—69 percent have one, 23 percent have two, and 8 percent have three or more. Most (84 percent) of these part-time jobs are in-person, 6 percent are fully remote, and 10 percent are hybrid. On the other hand, only 64 percent of the full-time positions are fully in-person, 27 percent are hybrid, and 9 percent fully remote. Ninety-one percent of those respondents with fully remote or hybrid full-time jobs do not expect their location status to change in the next year.
Only 11 percent of full-time employees work a second or third job, down from 2022’s 14 percent. Among those additional jobs, 23 percent are library positions, 30 percent in education or another related field, and 58 percent unrelated to libraries or education.
For those who earned an annual salary in their post-graduation placement, the average was $61,473, a 0.9 percent uptick from last year’s average of $60,911 and up a full 35 percent from 10 years ago. This is not as statistically significant as the 7.9 percentage increase seen in 2021 over 2020 grads’ salaries, in which the loosening of pandemic restrictions likely played a role, and average starting salaries may not see such a jump again. Among those who are paid hourly, the average wage was $22.05 per hour.
The gap between average salaries for men and women is still in evidence, but was smaller this year than last. Women’s salaries averaged 9 percent less than men’s in 2022, compared to 15.5 percent less in 2021.
Nearly one quarter—23 percent—took positions in the Midwest, closely followed by the Northeast. Only 1 percent took international jobs. Eighty-three percent said that the rise in remote jobs following the pandemic shutdowns did not lead them to apply beyond their local areas without intending to relocate.
Indeed, many did not have to move at all. Most respondents (85 percent, up from 2022’s 81 percent) did not have to relocate. After graduation, 60 percent remained with an employer or position held before or during their master’s programs—a slight increase from the 57 percent reported last year. Many of those who remained with their previous employers upon graduating in 2022 upgraded their situations: 31 percent received a raise, 23 percent were promoted, 20 percent were elevated from support to professional staff, 2 percent became eligible for tenure. “Licensure process allowed me to gain the title of Media Coordinator and no longer be on a probationary period,” explained Star Baughman of North Carolina.
Several respondents, however, expressed frustration that they have not found jobs that align with their degrees. Erica Kates of New York wrote of her position as a document specialist, “Although this is a full-time position which offers more money than I have previously earned, it is not directly archives- or LIS-related. Unfortunately, there is a dearth of full-time LIS opportunities where I live, and many require NY state certification, which I do not have.”
|
2022 TOTAL GRADUATES AND FULL-TIME PLACEMENTS BY SCHOOL* |
||||||
| TOTAL 2022 GRADUATES** | TOTAL RESPONDENTS | EMPLOYED FULL-TIME | ||||
| SCHOOLS | WOMEN | MEN | NONBINARY | ALL | ||
| Alabama | 84 | 16 | 11 | 1 | 1 | 13 |
| Arizona | 72 | 14 | 7 | 2 | 0 | 10 |
| Buffalo | 81 | 15 | 12 | 1 | 0 | 13 |
| Catholic | 65 | 11 | 7 | 2 | 0 | 10 |
| Chicago State | 7 | 6 | 3 | 1 | 1 | 5 |
| Denver | 96 | 20 | 12 | 3 | 2 | 17 |
| Emporia State | 168 | 20 | 9 | 3 | 1 | 13 |
| Hawai‘i Mãnoa | 13 | 4 | 2 | 0 | 0 | 2 |
| Illinois Urbana-Champaign | 278 | 28 | 17 | 6 | 2 | 25 |
| Indiana Purdue | 108 | 31 | 23 | 3 | 1 | 28 |
| Kent State* | 128 | 29 | 18 | 3 | 0 | 21 |
| Kentucky | 111 | 27 | 15 | 5 | 1 | 22 |
| Louisiana State | 117 | 36 | 29 | 2 | 2 | 34 |
| Maryland | 105 | 24 | 15 | 2 | 2 | 19 |
| Michigan* | 231 | 183 | 121 | 45 | 3 | 172 |
| Missouri | 124 | 14 | 6 | 3 | 2 | 11 |
| NC Chapel Hill* | 67 | 56 | 29 | 9 | 4 | 42 |
| NC Greensboro | 155 | 56 | 40 | 6 | 3 | 49 |
| North Texas | 380 | 34 | 23 | 4 | 0 | 27 |
| Pittsburgh | 58 | 10 | 5 | 0 | 2 | 8 |
| Pratt | 60 | 18 | 11 | 1 | 3 | 15 |
| Queens | 118 | 25 | 12 | 4 | 3 | 19 |
| Rutgers | 198 | 40 | 21 | 9 | 1 | 31 |
| San Jose* | 679 | 155 | 68 | 11 | 6 | 98 |
| Simmons | 274 | 63 | 39 | 6 | 3 | 50 |
| South Carolina* | 165 | 13 | 8 | 4 | 1 | 13 |
| Southern California | 47 | 16 | 10 | 2 | 0 | 12 |
| Southern Mississippi | 87 | 51 | 35 | 9 | 1 | 46 |
| St. Catherine | 50 | 13 | 9 | 0 | 1 | 10 |
| St. John's | 50 | 13 | 7 | 2 | 3 | 12 |
| Tennessee | 120 | 28 | 18 | 6 | 2 | 27 |
| Texas Woman's | 234 | 24 | 17 | 0 | 1 | 18 |
| Valdosta | 126 | 45 | 27 | 7 | 3 | 38 |
| Washington | 315 | 30 | 20 | 3 | 3 | 27 |
| Wayne State | 112 | 34 | 18 | 5 | 2 | 25 |
| Wisconsin Madison | 80 | 24 | 13 | 3 | 4 | 20 |
| Wisconsin Milwaukee | 112 | 30 | 16 | 3 | 2 | 22 |
| TOTAL | 5,275 | 1,256 | 753 | 176 | 66 | 1,024 |
|
Tables do not always add up, individually or collectively, due to omitted data from schools and/or individuals. |
||||||
WHAT DO PEOPLE DO ALL DAY?
The range of workplaces where recent grads landed did not differ significantly from previous years. Thirty-two percent of respondents found jobs in public libraries, similar to the 2022 survey’s 33 percent. Academic library job placements increased slightly, with 24 percent of graduates working in college and university libraries—up from 19 percent—and 4 percent in other academic units. Private industries employed 15 percent of graduates, slightly down from the class of 2021’s 17 percent. Nine percent worked in K–12 schools. Other organizations include non-academic archives and special collections, special libraries (e.g., medical, art, historical, corporate, and museum libraries that are not part of colleges or universities), government libraries or other government agencies, nonprofit organizations other than libraries, consulting, vendors (such as library automation and database companies), and others. Most of these, employing 2 or 3 percent of recent graduates, were similar to the 2022 survey’s numbers.
Many of those who described themselves as “librarian[s] not working for a library” said that they were using the proficiencies acquired in their LIS programs in a variety of ways. “My information-seeking skills are extremely beneficial for the grant funding field,” wrote Catherine Davis, a research advancement coordinator in Baton Rouge, LA. “I am also learning the structure of university administration, which was included in my academic librarianship course during my graduate school work.”
The most common job assignments that graduates were responsible for in their positions included reference and information services (50 percent); collection development and acquisitions (36 percent); circulation (34 percent); outreach (33 percent); patron programming (33 percent); public services (30 percent); readers’ advisory (30 percent); teaching, training and instruction (27 percent); access services (24 percent); metadata, cataloging, and taxonomy (22 percent); children’s services (21 percent); and information technology (21 percent).
When respondents narrowed these down to their primary job assignments, reference and information services was still the top answer. Other principal responsibilities for all positions included children’s services (9 percent), school librarian or library media specialist (9 percent), administration (6 percent), circulation (6 percent), and adult services (6 percent). Among full-time positions, the most common besides reference and information services were school librarian or library media specialist (9 percent); children’s services (9 percent); administration (7 percent); and metadata, cataloging, and taxonomy (6 percent). These differ from 2022’s results, which listed children’s services in first place, reference and information services second, and school librarian and library media specialist duties third.
Nine percent of respondents considered their positions to fall under “emerging library services.” While this may seem a small fraction given recent innovations in artificial intelligence (AI), virtual reality (VR), and other technologies, this marks the highest percentage in the past five years, slightly up from last year’s 8 percent. These emerging services include disciplines such as AI, data management, linked data, and open knowledge systems. “I’m working on special projects at Rider University with librarians who are [involved in] emerging technologies,” said Marissa Stinson, a part-time reference librarian in West Windsor, NJ, who works with VR, Chatbot on LibApps, and Credo Information Literacy. “I was hired to help them primarily as the library at Rider is currently understaffed for full-timers.”
Alondra Gil said that at her medical library, “All materials are transitioning to become available digitally and via the website only.” Other librarians are using new technology for patron programs, especially in teen services.
|
FULL-TIME SALARIES OF REPORTING PROFESSIONALS BY PRIMARY JOB ASSIGNMENT |
|||||
| PRIMARY JOB ASSIGNMENT | NO. RECEIVED | AVERAGE SALARY | MEDIAN SALARY | LOW SALARY | HIGH SALARY |
| Reference/Information Services | 64 | 56,715 | $53,250 | $21,168 | $95,000 |
| School Librarian/School Library Media Specialist | 59 | 57,497 | 55,000 | 33,000 | 108,000 |
| Children’s services | 46 | 52,705 | 52,094 | 24,960 | 82,000 |
| Administration | 38 | 60,360 | 55,000 | 27,040 | 120,000 |
| Metadata, Cataloging & Taxonomy | 33 | 54,383 | 50,000 | 28,000 | 120,000 |
| Training, Teaching & Instruction | 31 | 55,482 | 57,000 | 30,000 | 82,000 |
| Archival And Preservation | 30 | 51,430 | 52,000 | 35,000 | 73,000 |
| Adult Services | 27 | 51,083 | 50,000 | 24,000 | 92,000 |
| Access Services | 23 | 54,769 | 55,000 | 32,000 | 80,000 |
| YA/Teen Services | 22 | 52,653 | 57,250 | 30,000 | 63,000 |
| Circulation | 20 | 44,132 | 40,500 | 25,000 | 70,000 |
| Public services | 20 | 49,083 | 50,500 | 34,000 | 89,000 |
| Digital Content Management | 17 | 61,526 | 60,000 | 40,000 | 78,000 |
| Collection development/Acquisitions | 14 | 52,290 | 51,800 | 29,000 | 70,000 |
| Outreach | 14 | 56,059 | 55,000 | 43,899 | 72,180 |
| Technical services | 12 | 51,508 | 48,984 | 34,000 | 80,000 |
| Patron programming | 10 | 48,839 | 50,329 | 21,600 | 74,000 |
| Information technology | 8 | 55,084 | 47,500 | 20,000 | 94,000 |
| Knowledge management | 8 | 68,842 | 61,367 | 43,000 | 120,000 |
| Records management | 8 | 56,745 | 56,000 | 37,461 | 73,000 |
| Data Curation & Management | 7 | 57,122 | 58,956 | 40,000 | 70,500 |
| Data Analytics | 6 | 84,286 | 72,500 | 68,000 | 120,000 |
| Communications, PR, and social media | 5 | 59,756 | 58,500 | 45,000 | 75,000 |
| Government documents | 5 | 43,237 | 34,584 | 33,000 | 80,000 |
| User experience/Usability analysis | 5 | 49,600 | 52,000 | 25,000 | 90,000 |
| Solo librarian | 4 | 66,392 | 60,785 | 60,000 | 84,000 |
| Systems technology | 4 | 74,500 | 70,000 | 58,000 | 100,000 |
| Assessment | 2 | 114,000 | 114,000 | 73,000 | 155,000 |
| Budgeting/Finance | 2 | 80,560 | 80,560 | 80,000 | 81,120 |
| Grant writing | 2 | 44,000 | 44,000 | 38,000 | 50,000 |
| Website design | 2 | 71,000 | 71,000 | 62,000 | 80,000 |
| GIS | 1 | 70,000 | 70,000 | 70,000 | 70,000 |
| Market intelligence/Business research | 1 | 52,000 | 52,000 | 52,000 | 52,000 |
| Other | 32 | 57,231 | 57,108 | 29,532 | 130,000 |
|
THIS TABLE REPRESENTS FULL-TIME PLACEMENTS REPORTED BY PRIMARY JOB ASSIGNMENT. |
|||||
THE JOB SEARCH
Graduates began looking for work an average of 4.9 months before receiving their diplomas, although 14 percent noted that they began a year or more prior to graduation. The most popular window, reported by 34 percent of respondents, was four to six months before graduation; 22 percent started looking one to three months before. Twelve percent waited until graduation to begin looking for work, and 7 percent began their searches more than a month later. Getting an early start may have helped: 45 percent found employment prior to graduation, up from 38 percent for the class of 2021. Among the remaining respondents, an average of four months elapsed between graduation and placement.
“I recommend starting early, about one year before graduation, because of how long it takes to find employment,” librarian Erin Andreassi offered. “You’ll also save time and be more organized in the long run by keeping a log of all applications that you have submitted and the employers’ response to you. Also, don’t be afraid to negotiate salary! For my first librarian job, which was part-time at a medical library, the hospital offered me $23.50 an hour. I asked for $28 an hour and they agreed to pay me $27.”
Others have had different experiences. Youth services librarian Christina Burgos recalled, “I got my job offer while I was about to walk for my graduation ceremony.”
Job hunters used the time-honored strategies of networking and word-of-mouth as well as employment websites, the most popular of which were Indeed, Archives Gig, ALA’s job listing page, and LinkedIn. Other respondents cited Glassdoor, Google, GovernmentJobs, Handshake, HigherEdJobs, INALJ, and USA Jobs as sources.
|
COMPARISON OF FULL-TIME SALARIES BY TYPE OF ORGANIZATION |
|||||
| TOTAL PLACEMENTS | AVERAGE SALARY | MEDIAN SALARY | LOW SALARY | HIGH SALARY | |
| Archives/Special Collections | 22 | $50,687 | $51,000 | $34,600 | $78,000 |
| College/University | 209 | 55,670 | 56,000 | 24,000 | 120,000 |
| Consulting | 14 | 86,141 | 86,250 | 41,000 | 155,000 |
| Government | 16 | 49,929 | 43,900 | 33,000 | 78,592 |
| Nonprofit Organizations | 17 | 51,082 | 50,000 | 20,400 | 78,000 |
| Private Industry | 96 | 95,857 | 90,000 | 30,000 | 200,000 |
| Public Library | 195 | 52,524 | 50,500 | 20,000 | 130,000 |
| School Library | 76 | 57,741 | 55,500 | 33,000 | 108,000 |
| Special Library | 19 | 65,118 | 60,000 | 45,000 | 120,000 |
| Other Organizations | 35 | 65,018 | 61,900 | 34,584 | 198,000 |
|
THIS TABLE REPRESENTS ONLY FULL-TIME SALARIES AND ALL PLACEMENTS REPORTED BY TYPE. A FEW INDIVIDUALS OMITTED PLACEMENT INFORMATION, RENDERING SOME INFORMATION UNUSABLE. |
|||||
Sixty-four percent of respondents cited previous employment experience, including internships, fieldwork, and practicum experience, as an important component in landing their first professional positions. Nearly half (45 percent) completed at least one internship while earning their degrees (9 percent did two, and 3 percent managed three or more). Half were in-person, 25 percent remote, and the remaining quarter were hybrid.
“Get your foot in the door before you graduate,” youth services librarian Emily Lail advised. “Almost every full-time interview I had asked about job experience.” Information services assistant branch manager Portia Montoy agreed, noting that “having library experience/work is just as important as having the MLS.”
The emphasis placed on prior experience by potential employers can be frustrating, however: Graduates can’t get a job without experience, and they can’t get experience without a job. “I am currently looking for a position at a library, but I’m struggling to find something that requires a master’s but doesn’t require years of experience,” said Rose Pendleton, who is currently employed as a case management/marketing manager. “Most positions that I tried to pursue prior to getting my master’s required a master’s. And now that I have my master’s, I can’t find positions that don’t require lots of experience that I don’t have because I didn’t already work at a library.”
Volunteer experience was also cited as an option, but not everyone felt it was a good one. Reference librarian Amelia Foster felt that paid work of any type was more advisable than volunteering. “There is a lot of stigma among some professionals about taking ‘paraprofessional’ positions once you have your MLIS,” she wrote. “In my experience, the paraprofessional, grant-funded, and temporary work was essential experience that led to obtaining full-time professional employment. It’s absurd to suggest someone would be better off volunteering to do professional work rather than make an hourly wage. Volunteering to do professional work devalues the entire field.”
Thirty-five percent attributed their successes at least partially to networking with professionals in the field. “It really is about who you know and have formed relationships with,” wrote business manager Kayl Parker. “I only have the job I have now because of previous professional connections. I’m an introvert, and networking is a skill I had to build up (and that was not easy)—but it is mandatory, in my opinion.”
Networking can take multiple forms, noted adult services librarian Micah Flores. “[R]each out to any connections you may have in the field!” she wrote. “I had several of my colleagues work with me to polish my résumé [and] cover letter, and even do a couple of mock interviews. This helped me become more comfortable in speaking to my experience, accomplishments, and marketing myself in general to prospective employers.” She added, “If you do not have a personal network to consult with, there are a variety of online librarian groups/forums that you can use to connect with others in your field.”
MONEY MATTERS
President Joe Biden’s SAVE (Saving on a Valuable Education) plan is set to resume this month as interest begins to accrue on federal student loans after a pandemic-driven pause. However, loan forgiveness will take at least 10 years of regular payments to take effect, and more for larger loans, so paying off student debt is still a major concern for 57 percent of 2022 graduates.
Among those with debt, the average was $35,100 (up from last year’s $33,600) and the median $30,000. Seven percent owed less than $10,000 at the time they responded to the survey, 16 percent between $10,000 and $24,999, 19 percent between $25,000 and $49,999, 8 percent between $50,000 and $74,999, and 4 percent $75,000 or more. About half (53 percent) of those with student debt expected to receive public service loan forgiveness, and 50 percent of that group said that this factored into their career choices.
In answer to the question “What was/is the single most important thing you look for in an employer?” common answers included a respectful, supportive environment that values librarians; opportunities for professional development and advancement; and location. Metadata QA associate Abigail Robinson explained her strategy for determining a workplace’s suitability: “I speak to other employees and see how they feel about the company. If the employees are treated well, then it’s usually a good employer to work for.” Teacher librarian Diana Marques looks for “aligned values (pro-LGBTQ, proactively culturally responsive, proactively anti-bullying, anti-racist).”
As with any job, a living wage was the bottom line for many respondents. “Librarians have martyred themselves so much that their pay is meager despite the price of tuition for the required master’s degree necessary,” Library ILL assistant Olivia Pexton wrote. “It is not a field of equality. We are the part of government, expected to do all the work of other failed [government] programs and services, yet paid a fraction of a fraction of what other service professionals are paid.”
Among all the small shifts in numbers from one year to the next, one factor doesn’t change: a decent salary not only offers enough to live on but demonstrates respect. “A welcoming company culture is very important to me,” Erika Dawson, a children’s librarian, wrote. “A salary that reflects the necessity of my degree and allows me to support myself and my family is also important.”
|
FULL-TIME SALARIES BY TYPE OF ORGANIZATION AND GENDER |
|||||||||
| TOTAL PLACEMENTS | AVERAGE SALARY | ||||||||
| ORGANIZATION | Women | Men | Nonbinary* | All | Women | Men | Nonbinary* | All | |
| Archives/Special Collections | 14 | 4 | 3 | 22 | $48,433 | $53,750 | $61,353 | $50,687 | |
| College/University | 137 | 48 | 21 | 209 | 54,471 | 58,678 | 59,090 | 55,670 | |
| Consulting | 9 | 5 | - | 14 | 86,720 | 85,100 | - | 86,141 | |
| Government Library | 14 | 1 | 1 | 16 | 51,233 | 48,000 | 33,600 | 49,929 | |
| Nonprofit | 12 | 3 | 1 | 17 | 53,750 | 42,467 | 42,000 | 51,082 | |
| Private Industry | 69 | 21 | 2 | 96 | 93,075 | 101,696 | 113,500 | 95,857 | |
| Public Library | 141 | 35 | 15 | 195 | 50,472 | 58,418 | 54,458 | 52,524 | |
| School Library | 71 | 3 | 1 | 76 | 57,297 | 50,667 | 105,210 | 57,741 | |
| Special Library | 16 | 1 | 1 | 19 | 67,105 | 60,569 | 48,000 | 65,118 | |
| Other Organizations | 29 | 2 | 4 | 35 | 67,056 | 60,750 | 52,371 | 65,018 | |
|
THIS TABLE REPRESENTS ONLY FULL-TIME SALARIES AND ALL PLACEMENTS REPORTED BY TYPE. |
|||||||||
ARE THEY HAPPY?
Just over three-quarters of participants said they were satisfied with their placements. This was unchanged from 2022, which had represented a significant increase from 2021’s 65 percent. In this year’s survey, many expressed gratitude for finding either dream careers or “stepping-stone” jobs.
“I have the opportunity to perform archival management while establishing roots in Native American community archiving, which was my main focus during my master’s program,” wrote Kelsie Flack, a curating Indigenous digital collections fellow in Wisconsin. “I am passionate about what I do, and I know that the work that I am doing is benefitting the larger narrative of Indigenous information issues.”
Still, the road to finding those good jobs is not always straightforward, and many expressed frustration with the job-seeking process—and in that way as well, 2023 is not so different from 2022—or any other time. The desire to find fulfilling work with a sufficient salary and respectful workplace culture doesn’t change. But as the field continues to find its footing after the turmoil of the early pandemic years, many other factors will.
Andrew Gerber has worked in a variety of medical, public, academic, school, and nonprofit libraries. He holds an MLIS from Rutgers University School of Communication, Information, and Library Studies, and an MA in the Teaching of English from Columbia University Teachers College.

Added To Cart
RELATED


RECOMMENDED


TECHNOLOGY

ALREADY A SUBSCRIBER? LOG IN
We are currently offering this content for free. Sign up now to activate your personal profile, where you can save articles for future viewing
ALREADY A SUBSCRIBER? LOG IN
Thank you for visiting.
We’ve noticed you are using a private browser. To continue, please log in or create an account.
Add Comment :-
Comment Policy:
Comment should not be empty !!!