


2018 School Spending Survey Report
Social Explorer | Reference eReviews
Social Explorer enables users to create maps, reports, and presentations from a wide range of national and international survey data. An excellent resource, with customization tools that make data easy to create, and excellent visualization options for interpreting and presenting data.
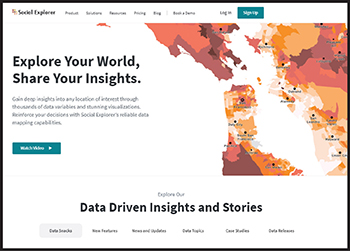
Social Explorer
 CONTENT
Social Explorer is a web-based mapping and data visualization program that enables users to create maps, reports, and presentations from a wide range of national and international survey sources. Through Social Explorer, researchers have access to more than 40 billion elements of current and historical data, including the full U.S. Census from 1790 to the present, the entire American Community Survey, the FBI Uniform Crime Report, the Religious Congregations and Membership Study, County Health Rankings and Roadmaps Program data, and U.S. business patterns. Although Social Explorer’s focus is on the United States, international data from the UK, Canada, Eurostat, and World Development Indicators is represented.
Although much of Social Explorer’s content is historical in nature, it also contains detailed datasets on the COVID-19 pandemic, the Black Lives Matter movement, and the 2020 U.S. presidential election, as well as the most current Law Enforcement Management and Administrative Statistics survey, which consists of data from a nationally representative sample of city and county police departments, sheriff’s offices, and state police agencies. Librarians should be aware that governments and police forces have often gathered demographic information through broad surveillance, particularly of marginalized communities. Data mapping of this kind can also be used to further exploit or intimidate targeted populations. Since these issues are not addressed in the scope of the database, librarians might usefully consult additional resources.
USABILITY
Social Explorer enables subscribers to communicate complex and detailed information effectively, in understandable and visually appealing maps and reports. Its simple interface loads quickly, with a high degree of functionality. The loading page defaults to “explore maps”—one of several user options located on the left side of the main screen. Front and center on the screen is a population density map of the United States; other U.S. and international data maps are easily accessible by scrolling down the page.
Other options include “create new,” “my projects,” “tables,” “teach and learn,” “geodata,” and “data dictionary.” Links to the Social Explorer website, blog, help section, feedback, 508 compliance, and demographic profiles are just below these options. At the top of the page are an “explore maps” tag and two icons: one for news and updates, and one for answering questions about using the database.
“Create new” allows users to design maps, generate reports (customized or based on existing templates), and activate tools for explaining, comparing, and contrasting data for presentations. “My projects” lists all user projects, categorizing them by maps, stories, reports, and templates. “Tables” contains general tables of information, in subjects such as crime, religion, and health. “Teach and learn” includes resources for teachers and students. Training modules offer instruction for using Social Explorer features like the layer library or types of visualization. “Lecture launchers” include activities for using the maps to answer questions about topics such as gerrymandering, consumer behavior, and criminal justice. “Data snacks” are briefer but similar activities, including “closures during coronavirus pandemic” and “enrolled students across the U.S.” Users can filter lecture launchers by subject, topic, length, and level, and data snacks by category and topic.
“Geodata” lets researchers download U.S. geographies from 1790 to 2019 in Shapefiles for GIS software. The “data dictionary” provides technical documentation and methodology for the surveys and reports.
Of special note, the “demographic profiles” link opens a page that lets users search demographic and education profiles across U.S. states, cities, counties, metropolitan service areas, and zip codes. Searches quickly yield comprehensive results on race, gender, age, education levels, and more.
Users will likely spend most of their time browsing “explore maps.” They can click on datasets such as COVID-19 data or U.S. election data. Within an individual dataset, a “change data” window pops up, with variables for research, such as income, population, and transportation. Customization options, available via a dropdown menu in the “change data” window, let users create a report, limit data to a select region, filter areas by search criteria, upload data, add layers of data, view a map by satellite, and annotate a map by adding markers, lines, shapes, or grounded overlays.
Social Explorer uses three types of visualization: shaded areas, bubbles, and dot density. Shading is used for percentages, medians, rates, population levels, and other area-normalized measures. Shaded area maps display data as a series of colors that fill in geographic areas with multiple shading options. Color shades and gradients can be changed. Bubbles and dots are used for counts. With bubbles, data is represented by a series of circles that are centered at the midpoint of the geographic areas they represent. Bubble sizes can be enlarged. In dot density visualizations, one dot is given a value, and then a random scattering of dots is used to represent the variable value for that level of geography.
Social Explorer has so much information, and so many ways to retrieve, report, and customize data, that new researchers are strongly advised to take full advantage of the “help” menu, which goes into lengthy detail about options for accessing, creating, downloading, saving, sharing, and exporting data. There, users can also find appropriate variables, learn to properly apply tools to compare, gain an understanding of variables and trends, and get tips for customizing the look and content of maps.
Maps can be exported as either PNG files or PowerPoint slides. Reports can be exported, saved, and printed. Social Explorer is Counter 5 compliant. The VPAT statement is available via the 508 compliance link on the home page.
PRICING
Costs range from $1,350 to $7,200 per year, based on population served. This includes access for all staff members and all patrons. Libraries should contact Social Explorer for specific pricing.
VERDICT
Social Explorer is an excellent resource, with extensive content, a simple interface, customization tools that make data easy to create, and excellent visualization options for interpreting and presenting data. Yet libraries may also want to look at Policy Map and SimplyAnalytics, two other high-quality data and mapping tools. Policy Map offers extensive U.S. public policy data and mapping options, with a focus on data gathered since the early 2000s. SimplyAnalytics concentrates on business and commercial activities from the 2000s to now, with thematic maps about consumers, markets, and business in the U.S. and Canada.
By contrast, Social Explorer prioritizes historical demographic patterns of the American experience, although datasets relating to present-day issues are being added. Regardless of the comparison, Social Explorer should do well, given its high quality and usefulness.
Rob Tench is a Librarian at Old Dominion University Libraries, Norfolk, VA.

Added To Cart
RELATED


RECOMMENDED


TECHNOLOGY

ALREADY A SUBSCRIBER? LOG IN
We are currently offering this content for free. Sign up now to activate your personal profile, where you can save articles for future viewing
ALREADY A SUBSCRIBER? LOG IN
Thank you for visiting.
We’ve noticed you are using a private browser. To continue, please log in or create an account.

Add Comment :-
Comment Policy:
Comment should not be empty !!!