


2018 School Spending Survey Report
Gale Analytics Demographic Data Platform Launches Interactive Dashboards
Gale, a Cengage company, today introduced five interactive dashboards for its Gale Analytics demographic data visualization platform.
 Gale, a Cengage company, today introduced five interactive dashboards for its Gale Analytics demographic data visualization platform. Gale Analytics leverages data from consumer reporting agency Experian’s “Mosaic USA” household segmentation system along with other datasets, and combines it with information from an integrated library system (ILS). To ensure privacy, patron addresses and circulation data are disassociated from their names and card numbers. The merged information offers granular, local demographic information at the neighborhood or even street level, enabling users to better understand the lifestyles of patrons they are serving or not currently serving, and then develop targeted, customized services or outreach campaigns.
According to the company, the new dashboards include the following:
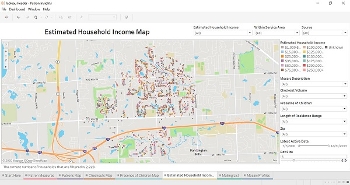
- Community Insights: Segments households in a library’s service area based on interest, income, presence of children, as well as which households include existing patrons or non-patrons. Libraries can use the dashboard to build custom marketing lists with household addresses or email.
- Patron Insights: Similar to community insights, but focused specifically on existing patrons, this dashboard is designed to help libraries better understand their current users at the household level based on interests, income, technology use, presence of children, and more.
- Digital Collections: This dashboard blends data from ebook and audiobook vendors with Mosaic segmentation and lifestyle data to provide insights into which households the library is currently serving with its digital collections, and is designed to help inform collection development.
- Physical Collections: A collection analysis dashboard that merges checkout data from a library’s ILS with Mosaic segmentation data, enabling a library to examine what books and other physical materials are popular with which local demographic groups / Mosaic lifestyle “segments.”
- Branches: This dashboard tracks cardholder activity across multi-branch systems, offering insight into how different demographic groups / Mosaic lifestyle “segments” are using their home and non-home branches, helping libraries customize materials, programs, services, and outreach by location.
“As online learning becomes the new normal, public libraries must ensure they have the right programs and services in place to meet patron and community needs,” Leigh Ann Cusack, senior director of public and consortia product at Gale, said in an announcement. “Now with interactive dashboards available across all reports, Gale Analytics enables libraries to really drill down and actively analyze data to gain deeper insights on the households in their service areas. Its dynamic visuals and filterable variables like household income and branch usage provide libraries a view into areas of opportunity to meet emerging needs.”
Gale will host a free, live webinar titled Dial Up Your Outreach with Data on July 15 at 2 p.m. ET for librarians interested in learning more about Gale Analytics and the dashboards.

Added To Cart
RELATED


RECOMMENDED


TECHNOLOGY

ALREADY A SUBSCRIBER? LOG IN
We are currently offering this content for free. Sign up now to activate your personal profile, where you can save articles for future viewing
ALREADY A SUBSCRIBER? LOG IN
Thank you for visiting.
We’ve noticed you are using a private browser. To continue, please log in or create an account.

Add Comment :-
Comment Policy:
Comment should not be empty !!!