


2018 School Spending Survey Report
Deal or No Deal | Periodicals Price Survey 2019
For the past decade, libraries have battled declining university budgets and increasing serials expenditures. With each Big Deal package renewal or cancellation, librarians and publishers have asked themselves: Did I make the best deal? Did I make the right deal? Recent developments in open access promise to bring major reform to academic publishing and, with that, new challenges and opportunities to the way that librarians and publishers choose to deal.
Pressure increases on publishers to move more quickly to open access, but this leaves many questions unanswered
For the past decade, libraries have battled declining university budgets and increasing serials expenditures. With each Big Deal package renewal or cancellation, librarians and publishers have asked themselves: Did I make the best deal? Did I make the right deal? Recent developments in open access (OA) promise to bring major reform to academic publishing and, with that, new challenges and opportunities to the way that librarians and publishers choose to deal.
ECONOMIC CONTEXT
The U.S. economy continued to expand in 2018 at a slightly higher pace than in 2017. According to the U.S. Bureau of Economic Analysis, real gross domestic product (GDP) increased at an annual rate of 4.2% in the second quarter of 2018 and 3.4% in the third quarter. The increase in real GDP in the third quarter reflected positive contributions from personal consumption expenditures; private inventory investment; federal, state, and local government spending; and nonresidential fixed investment—all of which were partly offset by negative contributions from exports. The Consumer Price Index for All Urban Consumers declined 0.1% in December on a seasonally adjusted basis after being unchanged in November. Over the last 12 months, the all items index increased 1.9% before seasonal adjustment. The index for all items less food and energy rose 0.2% in December, up 2.2% over the year.
According to the National Association of State Budget Officers (NASBO), states enacted appropriation increases for FY19 totaling $41.1 billion across all program areas, compared with just $12.7 billion in new appropriations enacted in their FY18 budgets one year prior. The Grapevine Survey for January 2019 also has encouraging news, noting that states spent 3.7% more supporting higher education in FY18/19 than in the previous fiscal year. The small rise continues a five-year upward trend that this year totals about $91.5 billion.
However, these gains are not translating to the higher education environment. The Center on Budget and Policy Priorities notes that state spending on higher education remains below 2008 levels. Of the 49 states (all except Illinois) analyzed over the full 2008–18 period, after adjusting for inflation, 45 spent less per student in the 2018 school year than in 2008. The average state spends $1,502, or 16% less, per student in 2018 than in 2008. After adjusting for inflation, overall state funding for the school year ending in 2018 was still $7 billion below its 2008 level. Many rural colleges and universities without a research focus are consolidating with other colleges, or closing entirely, as a decade of budget cuts and falling enrollments take their toll. The Ithaka S+R-OCLC survey noted that many academic libraries are reducing, proportionally, their allocations to collections in favor of other areas.
METHODOLOGY
The price survey, except for Table 3, uses a print-preferred pricing model based on the standard retail price for the titles in the selected indexes. Print pricing is used for consistency because not all publishers make their online-only pricing available or have a standard online-only retail price. The index does contain pricing for print + online and online only, but only if those were the only rates offered. Print-only pricing is now 43% of the data used in these tables, so despite difficulties getting online pricing, more journals are shifting to some form of online pricing, reflecting the overall decline in print.
The survey uses a combination of title sets to provide different views of the impact of inflation on libraries. Titles indexed in the Clarivate Analytics (formerly ISI) Arts and Humanities Index, Science Citation Abstracts, and Social Science Citation Index provide data that is useful for large academic libraries. The data from these indexes is sorted by discipline as well as online only. Titles indexed in EBSCO’s Academic Search Ultimate database represent the titles most commonly held in general academic and public library collections. Data from EBSCO’s MasterFILE Premier is included to provide a data set that would be germane to smaller public and school libraries.
|
TABLE 1: AVERAGE 2019 PRICE FOR SCIENTIFIC DISCIPLINES |
|
|---|---|
|
DISCIPLINE |
AVERAGE PRICE PER TITLE |
|
Chemistry |
$5,950 |
|
Physics |
$5,089 |
|
Engineering |
$3,994 |
|
Biology |
$3,769 |
|
Food Science |
$3,219 |
|
Technology |
$2,961 |
|
Geology |
$2,905 |
|
Astronomy |
$2,638 |
|
Zoology |
$2,624 |
|
Botany |
$2,615 |
|
Geography |
$2,277 |
|
Math & Computer Science |
$2,176 |
|
Health Sciences |
$2,156 |
|
Agriculture |
$2,072 |
|
General Science |
$2,038 |
Table 1. Average prices for science, technology, and medical (STM) serials remain the highest, compared with prices for serials in other subject areas. Chemistry has historically seen the highest average serials prices and that has not changed. This year’s data reports the average price for chemistry journals is $5,950 annually. There were only slight shifts in relative rankings for subject areas based on the overall average prices for serials. Content from the five major publishers—Elsevier, Springer, Wiley, Taylor & Francis, and SAGE—continues to represent more than half (59%) of the titles in the merged Clarivate Analytics indexes.
|
TABLE 2: TITLES INDEXED IN SCOPUS COST HISTORY BY LIBRARY OF CONGRESS SUBJECT |
|||||||
|---|---|---|---|---|---|---|---|
|
SUBJECT |
AVERAGE NO. OF TITLES 2017-19 |
% OF CHANGE 2017-19 |
AVERAGE |
AVERAGE |
% OF |
AVERAGE COST PER TITLE 2019 |
% OF CHANGE 2019 |
|
Business & Economics |
1,517 | -27 | $1,087 | $1,134 | 4 | $1,201 | 6 |
|
Fine Arts |
315 |
-5 | $406 | $431 | 6 | $452 | 5 |
|
Health Sciences |
4,393 |
-104 | $1,062 | $1,136 | 7 | $1,240 | 9 |
|
Humanities |
2,385 |
28 | $352 | $373 | 6 | $397 | 6 |
|
Law |
358 | -15 | $539 | $535 | -1 | $573 | 7 |
|
Life Sciences |
2,304 |
-52 | $1,654 | $1,741 | 5 | $1,861 | 7 |
|
Social Sciences |
2,320 |
6 | $733 | $780 | 6 | $836 | 7 |
|
STEM |
5,352 |
-30 | $1,732 | $1,827 | 5 | $1,948 | 7 |
|
TOTAL/AVERAGE |
18,944 |
-199 | $1,176 | $1,242 | 6 | $1,330 | 7 |
|
SOURCE: LJ PERIODICALS PRICE SURVEY 2019 |
|||||||
Table 2: For 2019, the study expanded to include approximately 18,944 priced titles indexed by Scopus, creating our largest sample to date. Increasing the sample size makes the results more reliable. The data from the Scopus list increased at 7% for 2019, a higher percentage compared to previous years.
|
TABLE 3: COST HISTORY FOR ONLINE TITLES IN CLARIVATE ANALYTICS (FORMERLY ISI) INDEXES |
||||||
|---|---|---|---|---|---|---|
|
SUBJECT |
AVERAGE NO. OF TITLES 2017-19 |
AVERAGE COST PER TITLE 2017 |
AVERAGE COST PER TITLE 2018 |
% OF CHANGE 2017-18 |
AVERAGE COST PER TITLE 2019 |
% OF CHANGE 2017-19 |
|
Agriculture |
86 |
$1,076 |
$1,153 |
7 |
$1,213 |
5 |
|
Anthropology |
41 |
465 |
505 |
9 |
536 |
6 |
|
Arts & Architecture |
92 |
375 |
401 |
7 |
422 |
5 |
|
Astronomy |
13 |
1,742 |
1,866 |
7 |
1,959 |
5 |
|
Biology |
202 |
2,507 |
2,685 |
7 |
2,849 |
6 |
|
Botany |
24 |
1,977 |
2,098 |
6 |
2,215 |
6 |
|
Business & Economics |
381 |
1,625 |
1,751 |
8 |
1,834 |
5 |
|
Chemistry |
73 |
4,588 |
4,744 |
3 |
4,984 |
5 |
|
Education |
135 |
954 |
1,021 |
7 |
1,093 |
7 |
|
Engineering |
197 |
2,149 |
2,306 |
7 |
2,433 |
5 |
|
Food Science |
15 |
2,531 |
2,673 |
6 |
2,808 |
5 |
|
General Science |
42 |
1,293 |
1,338 |
3 |
1,389 |
4 |
|
General Works |
62 |
218 |
234 |
7 |
245 |
5 |
|
Geography |
63 |
1,359 |
1,448 |
7 |
1,543 |
7 |
|
Geology |
39 |
1,230 |
1,317 |
7 |
1,391 |
6 |
|
Health Sciences |
568 |
1,699 |
1,810 |
7 |
1,905 |
5 |
|
History |
289 |
412 |
439 |
6 |
472 |
8 |
|
Language & Literature |
416 |
340 |
368 |
8 |
389 |
6 |
|
Law |
89 |
418 |
445 |
6 |
468 |
5 |
|
Library Science |
31 |
594 |
629 |
6 |
657 |
4 |
|
Math & Computer Science |
104 |
1,518 |
1,603 |
6 |
1,706 |
6 |
|
Military & Naval Science |
11 |
920 |
947 |
3 |
1,014 |
7 |
|
Music |
53 |
293 |
319 |
9 |
332 |
4 |
|
Philosophy & Religion |
195 |
371 |
395 |
6 |
418 |
6 |
|
Physics |
107 |
3,564 |
3,756 |
5 |
3,946 |
5 |
|
Political Science |
91 |
736 |
792 |
8 |
852 |
8 |
|
Psychology |
111 |
892 |
953 |
7 |
1,022 |
7 |
|
Recreation |
39 |
731 |
777 |
6 |
820 |
6 |
|
Social Sciences |
43 |
873 |
942 |
8 |
996 |
6 |
|
Sociology |
265 |
838 |
940 |
12 |
999 |
6 |
|
Technology |
49 |
2,019 |
2,119 |
5 |
2,310 |
9 |
|
Zoology |
66 |
2,319 |
2,449 |
6 |
2,573 |
5 |
|
TOTAL/AVERAGE |
3,992 |
1,276 |
1,362 |
7 |
1,438 |
6 |
|
SOURCE: LJ PERIODICALS PRICE SURVEY 2019 |
||||||
Table 3: Table 3 examines the titles in the combined Clarivate Analytics Arts and Humanities, Science Citation, and Social Sciences Citation indexes that offer published rates for online formats. This table now has 71% of the titles in the full tables. As in past years, the data reflects online-only, print-plus-online, with the prices based on the first tier of any tiered pricing. As in Table 1, STM titles are the most expensive, with chemistry titles having the highest average cost, $4,588. The 2019 average cost for this set of titles is $1,438, a 6% increase from the 2018 average price of $1,362. It is important to bear in mind that the individual titles in the data set and associated pricing models reflected by Table 3 change each year, so the price increases can be owing to changes in the data as well as actual price changes. What does remain consistent is the annual increase, falling in the 5–6% range, and the relative high cost of titles by subject areas, with science and technology at the top of the chart.
For comparison purposes, the rate of price increase is analyzed for more than 18,000 e-journal packages handled by EBSCO Information Services. Packages are a large part of the periodicals marketplace, so the rate of price increase for these is important data. For 2019, the average rate of increase over two years was 5.5%, up slightly from 5% in 2018.
Periodical Prices for High School and Public Libraries
|
TABLE 4: COST HISTORY FOR TITLES INDEX IN MASTERFILE PREMIER |
||||||
|---|---|---|---|---|---|---|
|
Overall price increases for titles in EBSCO Publishing’s Masterfile Premier are expected to be in the 6.5%–7.0% range. |
||||||
|
MASTERFILE |
NO. OF TITLES 2017-19 |
AVERAGE COST PER TITLE 2017 |
AVERAGE COST PER TITLE 2018 |
% OF CHANGE 2017-18 |
AVERAGE COST PER TITLE 2019 |
% OF CHANGE 2018-19 |
|
U.S |
1,009 |
$261 |
$278 |
6.7 |
$298 |
7.1 |
|
NON-U.S. |
218 |
378 |
397 |
5.0 |
423 |
6.6 |
|
SOURCE: LJ PERIODICALS PRICE SURVEY 2019 |
||||||
Periodical Prices for University and College Libraries
|
TABLE 5: 2020 COST PROJECTIONS FOR TITLES INDEXED IN ACADEMIC SEARCH PREMIER/ULTIMATE |
||||||||
|---|---|---|---|---|---|---|---|---|
|
Overall price increases for titles in EBSCO’s Academic Search Premier/Ultimate are expected to be in the 6%–6.5% range for 2020. |
||||||||
|
ACADEMIC |
NO. OF TITLES |
% OF LIST |
2019 AVERAGE COST PER TITLE |
% OF COST |
PROJECTED % OF INCREASE |
PROJECTED 2020 AVERAGE COST PER TITLE |
% OF COST |
PROJECTED OVERALL % INCREASE |
|
U.S |
2,674 |
40 |
$1,187 |
29 |
6.4 |
$1,263 |
29 | 6.4 |
|
NON-U.S. |
4,091 |
60 |
1,903 |
71 |
6.4 |
2,025 |
71 | N/A |
|
SOURCE: LJ PERIODICALS PRICE SURVEY 2019 |
||||||||
|
TABLE 6: COST HISTORY FOR TITLES IN ACADEMIC SEARCH PREMIER/ULTIMATE |
|||||||
|
SUBJECT |
AVERAGE NO. OF TITLES 2017 - 19 |
% OF CHANGE 2017-19 |
AVERAGE COST PER TITLE 2017 |
AVERAGE COST PER TITLE 2018 |
% OF CHANGE 2018 |
AVERAGE COST PER TITLE 2019 |
% OF CHANGE 2019 |
|
Agriculture |
195 |
-1 |
$1,311 |
$1,401 |
7 |
$1,497 |
7 |
|
Anthropology |
53 |
1 |
600 |
644 |
7 |
681 |
6 |
|
Arts & Architecture |
60 |
1 |
444 |
476 |
7 |
511 |
7 |
|
Astronomy |
26 |
1 |
1,302 |
1,385 |
6 |
1,407 |
2 |
|
Biology |
465 |
0 |
2,795 |
2,966 |
6 |
3,135 |
6 |
|
Botany |
65 |
0 |
1,453 |
1,546 |
6 |
1,648 |
7 |
|
Business & Economics |
231 |
1 |
954 |
1,002 |
5 |
1,067 |
7 |
|
Chemistry |
176 |
1 |
4,828 |
4,986 |
3 |
5,212 |
5 |
|
Education |
277 |
1 |
816 |
870 |
7 |
938 |
8 |
|
Engineering |
620 |
1 |
2,633 |
2,783 |
6 |
2,958 |
6 |
|
Food Science |
34 |
1 |
1,645 |
1,678 |
2 |
1,846 |
10 |
|
General Science |
81 |
-1 |
1,497 |
1,602 |
7 |
1,707 |
7 |
|
General Works |
91 |
0 |
250 |
292 |
17 |
296 |
1 |
|
Geography |
100 |
0 |
1,374 |
1,464 |
7 |
1,575 |
8 |
|
Geology |
84 |
-1 |
2,191 |
2,359 |
8 |
2,521 |
7 |
|
Health Sciences |
1,309 |
11 |
1,437 |
1,527 |
6 |
1,617 |
6 |
|
History |
387 |
-1 |
410 |
434 |
6 |
469 |
8 |
|
Language & Literature |
331 |
1 |
406 |
429 |
6 |
460 |
7 |
|
Law |
245 |
-8 |
359 |
369 |
3 |
388 |
5 |
|
Library Science |
86 |
0 |
620 |
651 |
5 |
690 |
6 |
|
Math & Computer Science |
283 |
5 |
1,828 |
1,895 |
4 |
1,978 |
4 |
|
Military & Naval Science |
37 |
0 |
576 |
605 |
5 |
660 |
9 |
|
Music |
91 |
1 |
191 |
202 |
6 |
214 |
6 |
|
Philosophy & Religion |
322 |
0 |
303 |
318 |
5 |
340 |
7 |
|
Physics |
184 |
-1 |
3,928 |
4,103 |
4 |
4,319 |
5 |
|
Political Science |
116 |
1 |
681 |
727 |
7 |
785 |
8 |
|
Psychology |
181 |
1 |
854 |
918 |
7 |
969 |
6 |
|
Recreation |
40 |
0 |
719 |
785 |
9 |
849 |
8 |
|
Social Sciences |
46 |
0 |
786 |
836 |
6 |
893 |
7 |
|
Sociology |
349 |
-1 |
920 |
980 |
7 |
1,054 |
8 |
|
Technology |
70 |
0 |
1,879 |
1,972 |
5 |
2,093 |
6 |
|
Zoology |
123 |
0 |
1,177 |
1,237 |
5 |
1,288 |
4 |
|
TOTAL/AVERAGE |
6,758 |
14 |
1,447 |
1,528 |
6 |
1,620 |
6 |
|
SOURCE: LJ PERIODICALS PRICE SURVEY 2019 |
|||||||
MARKET REALITIES & OA
Big Deals remain the status quo for most academic libraries, despite years of declining budgets. However, retooling or outright cancellations of Big Deals is becoming more common, particularly when libraries are experiencing substantial budget cuts. Consortia in Hungary and Finland dropped out of select Big Deals. Florida State University, the University of Oklahoma, and the Max Planck Society (Germany) all recently ended a Big Deal, while the University of California (UC) System intends to restructure its Big Deals greatly, as contracts expire, to align future contracts with UC’s stance on open access. Toward that goal, it was announced in February 2019 that UC was terminating its Big Deal with Elsevier as it couldn’t complete renewal negotiations that would support a broad shift to OA. For news of other cancellations, the Association for Research Libraries’ SPARC site tracks Big Deal cancellations at sparcopen.org/our-work/big-deal-cancellation-tracking.
In sharp contrast to the continued contraction of library collection budgets, publishers are showing profits. The STM Report, 5th ed., states the annual revenues generated from English-language STM journal publishing are estimated at about $10 billion in 2017, within a broader STM information publishing market worth some $25.7 billion. About 41% of global STM revenues (including nonjournal STM products) come from the United States, 27% from Europe/the Middle East, 26% from Asia/Pacific, and 6% from the rest of the world. Open access is a bright spot for many commercial publishers and clearly seen as a revenue stream. Simba Information reports in Open Access Journal Publishing 2018–2022 that article processing charges (APCs) for OA publications accounted for sales of $494 million in 2017, with that number expected to grow to $702 million by 2022. The three publishers that are the market leaders in traditional subscription sales are also the market leaders in APC-funded OA journals; the leading ten OA publishers now hold 75% of the global OA market.
OA is now a worldwide initiative and becoming the de facto business model in some emerging markets. With its promise of public enrichment and accelerated discovery, OA greatly appeals to a library community dealing with flat budgets and reduced higher education funding. In Europe, mandated open access gained traction this past year with the launch of Plan S, which requires that, from 2020, scientific publications that result from research funded by public grants must be published in compliant OA journals or platforms. While the same isn’t true in the United States and China, an increasing number of institutions are becoming signatories of OA2020, which aims “to transform a majority of today’s scholarly journals from subscription to OA publishing.” There are currently more than 700 OA policies and mandates worldwide from a range of research institutes and funding bodies. The speed of uptake of OA has been dependent on publisher policies and the academic field, with gold OA being more quickly adopted in STM fields that have robust research funding, and slowly in social science and humanities fields.
Despite this momentum, 85% of the world’s scholarly output is still locked behind paywalls. Supporters of the OA2020 initiative pledge to convert resources spent on journal subscriptions to funds to support sustainability of OA, upending the subscription system and enabling barrier-free access to knowledge. Proponents of Plan S, launched by cOAlition S European research funders, aim to make papers immediately free to read. Both Plan S and OA2020 seek aggressive action to make publishers OA by the year 2020. Members of the academic community need to be informed about alternative approaches to open access and attempts to change the payment model for scholarly publishing to know what is viable. Green OA—depositing content in open repositories—is a very viable option for conforming to Plan S.
While large commercial publishers may be well positioned to transition to OA, society and not-for-profit publishing organizations are less prepared. Some publishers are concerned that OA may not only damage their publishing program but also the diversity of high-quality journals available. Results of a HighWire survey sent to 27 not-for-profit publishers show that most respondents will “stay the course” and not consider new publishing models until the consequences of Plan S become clearer.
|
TABLE 7: TITLES IN CLARIVATE ANALYTICS (FORMERLY ISI) INDEXES COST HISTORY BY LIBRARY OF CONGRESS SUBJECT |
|||||||
|
SUBJECT |
AVERAGE NO. OF TITLES 2017 - 19 |
% OF CHANGE 2017-19 |
AVERAGE COST PER TITLE 2017 |
AVERAGE COST PER TITLE 2018 |
% OF CHANGE 2018 |
AVERAGE COST PER TITLE 2019 |
% OF CHANGE 2019 |
|
Agriculture |
128 |
0 |
$1,828 |
$1,955 |
7 |
$2,072 |
6 |
|
Anthropology |
45 |
1 |
577 |
621 |
8 |
649 |
5 |
|
Arts & Architecture |
97 |
3 |
437 |
464 |
6 |
482 |
4 |
|
Astronomy |
15 |
1 |
2,481 |
2,653 |
7 |
2,638 |
-1 |
|
Biology |
418 |
0 |
3,364 |
3,568 |
6 |
3,769 |
6 |
|
Botany |
35 |
1 |
2,355 |
2,505 |
6 |
2,615 |
4 |
|
Business & Economics |
528 |
5 |
1,757 |
1,826 |
4 |
1,930 |
6 |
|
Chemistry |
159 |
0 |
5,506 |
5,671 |
3 |
5,950 |
5 |
|
Education |
158 |
2 |
1,059 |
1,137 |
7 |
1,223 |
8 |
|
Engineering |
342 |
0 |
3,548 |
3,760 |
6 |
3,994 |
6 |
|
Food Science |
22 |
0 |
2,829 |
3,021 |
7 |
3,219 |
7 |
|
General Science |
57 |
0 |
1,825 |
1,924 |
5 |
2,038 |
6 |
|
General Works |
68 |
2 |
225 |
241 |
7 |
248 |
3 |
|
Geography |
88 |
0 |
1,987 |
2,121 |
7 |
2,277 |
7 |
|
Geology |
71 |
0 |
2,558 |
2,725 |
7 |
2,905 |
7 |
|
Health Sciences |
1,082 |
5 |
1,903 |
2,028 |
7 |
2,156 |
6 |
|
History |
322 |
6 |
458 |
483 |
6 |
518 |
7 |
|
Language & Literature |
440 |
4 |
395 |
421 |
7 |
445 |
6 |
|
Law |
245 |
-8 |
359 |
369 |
3 |
388 |
5 |
|
Library Science |
86 |
0 |
620 |
651 |
5 |
690 |
6 |
|
Math & Computer Science |
283 |
5 |
1,828 |
1,895 |
4 |
1,978 |
4 |
|
Military & Naval Science |
37 |
0 |
576 |
605 |
5 |
660 |
9 |
|
Music |
91 |
1 |
191 |
202 |
6 |
214 |
6 |
|
Philosophy & Religion |
322 |
0 |
303 |
318 |
5 |
340 |
7 |
|
Physics |
184 |
-1 |
3,928 |
4,103 |
4 |
4,319 |
5 |
|
Political Science |
116 |
1 |
681 |
727 |
7 |
785 |
8 |
|
Psychology |
181 |
1 |
854 |
918 |
7 |
969 |
6 |
|
Recreation |
40 |
0 |
719 |
785 |
9 |
849 |
8 |
|
Social Sciences |
46 |
0 |
786 |
836 |
6 |
893 |
7 |
|
Sociology |
349 |
-1 |
920 |
980 |
7 |
1,054 |
8 |
|
Technology |
70 |
0 |
1,879 |
1,972 |
5 |
2,093 |
6 |
|
Zoology |
123 |
0 |
1,177 |
1,237 |
5 |
1,288 |
4 |
|
TOTAL/AVERAGE |
6,758 |
14 |
1,447 |
1,528 |
6 |
1,620 |
6 |
|
SOURCE: LJ PERIODICALS PRICE SURVEY 2019 |
|||||||
UNINTENDED CONSEQUENCES?
A completely open content environment may have results that have not been anticipated and could create more problems than it solves. OA changes how scholarship is used, disseminated, and evaluated. From all that is written on the shift to OA, we can envision some possible repercussions. One unintended result of a move to full OA based on a Plan S–type approach is that not all models result in a decrease in costs for dissemination of research. The APC business model incentivizes quantity over quality: the more articles published, the more revenue is generated. APCs will continue to rise, or if APC caps prevent that, the number of articles published will likely rise, so publishers could maintain revenue. Flat or declining library collections budgets mean that libraries may not be able to absorb these higher costs and will need to make careful decisions about which disciplines they support. Financially stretched universities could begin to restrict access to APC funds to already highly rated and research active departments or to STM disciplines that have greater access to research funding. Pathways toward an open content future that do not address the overall affordability of scholarly publishing, and an appropriate distribution of costs, could cause more harm than good.
OA mandates such as Plan S and publish and read options may strengthen the grip commercial publishers presently have on the journal market. Those society or not-for-profit publishers that do not have the economies of scale required to comply with Plan S may be driven to seek publishing agreements with commercial houses.
There are many unanswered questions. How will libraries manage APCs and retool themselves in the OA environment? What about commercial use of OA resources? Is there a viable solution for highly selective subscription journals to satisfy Plan S? The scholarly publishing landscape will continue to grapple with these questions in the years to come.
|
TABLE 8: 2020 COST PROJECTIONS BY BROAD SUBJECT |
|||||||||
|
|
NO. OF TITLES |
% OF LIST |
2019 COST |
% OF COST |
AVERAGE COST PER TITLE |
PROJECTED % OF INCREASE |
PROJECTED 2020 COST |
% OF COST |
PROJECTED OVERALL % INCREASE |
| ARTS & HUMANITIES CITATION INDEX | |||||||||
|
U.S. |
422 |
34 |
$105,787 |
20 |
$208 |
5.5 |
$111,605 |
20 | 6.3 |
|
NON-U.S. |
812 |
66 |
427,812 |
80 |
527 |
6.5 |
455,620 |
80 | |
|
SOCIAL SCIENCES CITATION INDEX |
|||||||||
|
U.S. |
806 |
41 |
737,450 |
27 |
915 |
6.9 |
788,813 |
27 | 6.8 |
|
NON-U.S. |
1,183 |
59 |
1,955,405 |
73 |
1,653 |
6.8 |
2,088,372 |
73 | |
|
SCIENCE CITATION INDEX |
|||||||||
|
U.S. |
998 |
42 |
2,871,206 |
35 |
2,877 |
6.5 |
3,057,834 |
35 | 5.8 |
|
NON-U.S. |
1,406 |
58 |
5,343,589 |
65 |
3,801 |
5.4 |
5,632,142 |
65 | |
|
PROJECTED OVERALL INCREASE FOR ALL CLARIVATE TITLES: 6.1% |
|||||||||
|
SOURCE: LJ PERIODICALS PRICE SURVEY 2019 |
|||||||||
2020 FORECAST
The six percent average price increase observed in 2019 is expected to remain constant for 2020, as it has every year since 2012. Although open access will change how research is created and accessed, it is unclear whether it will reduce expenditures for libraries or substantially change the way commercial publishers dominate the market. For another year, we can expect episodes of suspense, as we try to anticipate which libraries and publishers will say “Deal or No Deal.” In the end, however, any developments may feel like a repeat broadcast: while we were busy talking about changing scholarly publishing, the price for the content went up another six percent.
VALUE OF JOURNALS
Journal price data is important for budget management processes, but price alone is not the sole factor determining value. Metrics such as Impact Factor are important in assessing value, and similar value metrics will only increase in importance in the future. Improvements in usage data gathering (Counter 4 and 5) and developments in the altmetrics arena may provide even more data that could be used to help make qualitative assessments of the impact of scholarly publishing. Data-based decisions will be very important in determining values as libraries actively manage their information resources.
|
TABLE 9: COMPARISON OF AVERAGE PRICE OF TITLES IN CLARIVATE (FORMERLY ISI) INDEXES GROUPED BY PRICE TO IMPACT FACTOR, ETC. |
|||||||
|
PRICE BAND |
NO. OF TITLES |
AVERAGE PRICE 2019 |
% PRICE INCREASE 2018-19 |
AVERAGE LATEST IMPACT FACTOR |
AVERAGE EIGEN- FACTOR |
AVERAGE ARTICLE INFLUENCE SCORE |
AVERAGE COST PER CITATION |
|
Less than $201 |
765 |
$108 |
-0.1 |
1.81 |
0.2084 |
0.61 |
22¢ |
|
Between $201 and $550 |
1,068 |
378 |
5.0 |
2.36 |
0.3112 |
0.95 |
23¢ |
|
Between $551 and $1,075 |
1,241 |
782 |
6.5 |
2.30 |
0.5297 |
0.86 |
28¢ |
|
Between $1,076 and $2,290 |
1,410 |
1,580 |
6.8 |
3.39 |
1.5780 |
1.18 |
20¢ |
|
Biology |
1,547 |
5,436 |
6.1 |
4.06 |
2.6307 |
1.30 |
34¢ |
|
SOURCE: LJ PERIODICALS PRICE SURVEY 2019 |
|||||||
Altmetrics are not yet widely accepted for assessing scholarly materials, so other standardized metrics continue to dominate. There are flaws in the Impact Factor but nothing else has arisen to replace it. This year the survey continues to work with the title and publisher data collected for this article to explore the relationship between prices and metrics used to assess journals such as Impact Factor, Eigenfactor, and Article Influence Score. The relationship between serial prices and numbers of citations also was explored with interesting results.
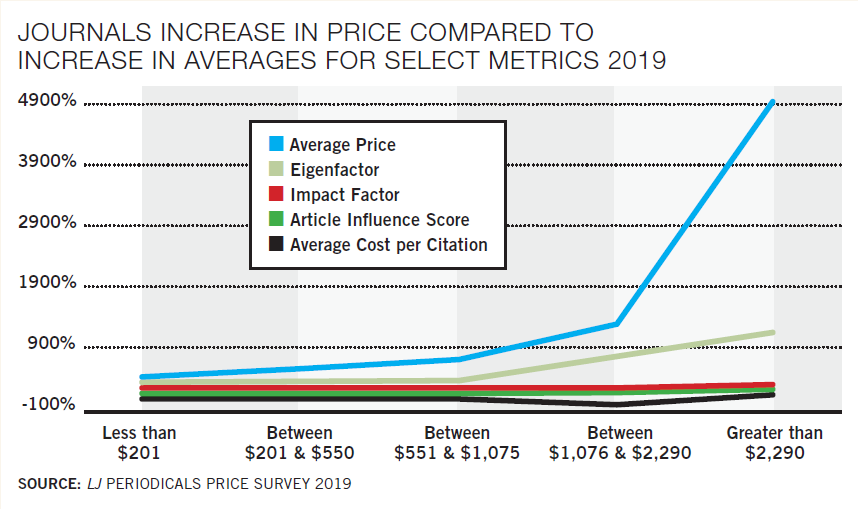
To examine the relationship between price and value, the titles in the merged Clarivate indexes for 2019 were divided into broad price categories. The selection of these categories was arbitrary, with the goal of ensuring that the number of titles in each area was reasonably comparable. The average for Impact Factor, Eigenfactor, and Article Influence Score for all titles in a price range was compared to the averages in the other price bands. The results are displayed in the chart above. All the value metrics tended to show an increase with the increase in price. However, this increase was significantly less than the increase in price.
Although there were increases in the metrics for Impact Factor and Eigenfactor, the increases were not comparable to the increase in price. The average price ($5,436) for the most expensive journals was 50 times higher than the least expensive ($108) journals, while the Impact Factor slightly more than doubled. The price increases for the more moderately priced titles were also lower than the more expensive titles. Higher priced titles do have higher Impact Factors and Eigenfactors, but the increase in the metrics is small when compared with the increase in costs.
|
TABLE 10: COMPARISON OF SERIAL PRICES WITH RATES OF CITATION BASED ON TITLES IN CLARIVATE ANALYTICS INDEXES |
||||
|
SUBJECT |
NO. OF TITLES |
TOTAL COST |
TOTAL CITATIONS |
COST PER CITE |
|
General Science |
73 |
$129,683 |
1,688,427 |
$0.08 |
|
Astronomy |
16 |
42,213 |
259,761 |
0.16 |
|
Heath Sciences |
1,310 |
2,644,446 |
12,061,673 |
0.22 |
|
Chemistry |
159 |
945,978 |
4,252,540 |
0.22 |
|
Geology |
72 |
206,315 |
830,006 |
0.25 |
|
Engineering |
354 |
1,392,200 |
5,559,876 |
0.25 |
|
Psychology |
177 |
215,873 |
825,840 |
0.26 |
|
Biology |
441 |
1,634,691 |
5,941,956 |
0.28 |
|
Physics |
167 |
854,365 |
3,023,580 |
0.28 |
|
Botany |
36 |
94,146 |
299,662 |
0.31 |
|
Technology |
73 |
204,363 |
645,339 |
0.32 |
|
Agriculture |
130 |
266,160 |
823,419 |
0.32 |
|
Food Science |
21 |
70,166 |
199,918 |
0.35 |
|
Geography |
93 |
209,525 |
476,168 |
0.44 |
|
Math & Computer Science |
163 |
351,488 |
696,611 |
0.50 |
|
Zoology |
87 |
224,058 |
404,842 |
0.55 |
|
Anthropology |
48 |
33,434 |
58,929 |
0.57 |
|
Business & Economics |
580 |
1,113,357 |
1,957,542 |
0.57 |
|
Sociology |
301 |
375,455 |
622,250 |
0.60 |
|
Education |
166 |
202,565 |
304,610 |
0.66 |
|
Recreation |
52 |
46,788 |
69,738 |
0.67 |
|
Law |
111 |
58,785 |
85,117 |
0.69 |
|
Political Science |
100 |
100,500 |
138,992 |
0.72 |
|
Library Science |
53 |
52,556 |
71,531 |
0.73 |
|
Social Sciences |
60 |
65,015 |
85,109 |
0.76 |
|
Military & Naval Science |
15 |
17,937 |
19,870 |
0.90 |
|
History |
321 |
170,263 |
112,930 |
1.51 |
|
General Works |
67 |
16,872 |
10,150 |
1.66 |
|
Language & Literature |
436 |
198,452 |
111,371 |
1.78 |
|
Arts & Architecture |
100 |
48,385 |
26,057 |
1.86 |
|
Music |
53 |
19,530 |
7,422 |
2.63 |
|
Philosophy & Religion |
205 |
92,519 |
16,032 |
5.77 |
|
TOTAL/AVERAGE |
6,040 |
$12,098,083 |
41,687,268 |
$0.29 |
|
SOURCE: LJ PERIODICALS PRICE SURVEY 2019 |
||||
The ratio of citations to serial costs by subject is reviewed in Table 10. For STM journals, the average prices tend to be high in comparison to other subjects. This scenario changes if the costs are divided by the numbers of citations for the journals. Chemistry has the highest average price, but chemistry has the fourth lowest cost per citation. Journals in chemistry are very expensive but heavily cited. If citations are considered an indicator of value, then chemistry journals, despite high average prices, are high-value journals. Conversely, journals in philosophy, music, and art are relatively cheap but are infrequently cited, so journals in those areas show
the highest cost per citation.
Based upon this set of data, if cost per citation is reviewed by type of publisher, it is not surprising that commercial publishers have higher per citation costs than other types of publishers. Commercial publishers showed a cost per citation of 39¢ (average price $2,362 and average five-year Impact Factor 3.08), while university presses showed 18¢ (average price $558 and average five-year Impact Factor 2.33) and societal publishers showed 8¢ (average price $1,402 and average five-year Impact Factor 4.13).
Stephen Bosch is Materials Budget, Procurement, and Licensing Librarian, University of Arizona Library, Tucson; Barbara Albee is an Account Services Manager, EBSCO Information Services (EIS), Birmingham, AL; and Sion Romaine is Director of Acquisitions & Rapid Cataloging Services, University of Washington Libraries, Seattle.

Added To Cart
RELATED


RECOMMENDED


TECHNOLOGY

ALREADY A SUBSCRIBER? LOG IN
We are currently offering this content for free. Sign up now to activate your personal profile, where you can save articles for future viewing
ALREADY A SUBSCRIBER? LOG IN
Thank you for visiting.
We’ve noticed you are using a private browser. To continue, please log in or create an account.

Add Comment :-
Comment Policy:
Comment should not be empty !!!
Zulma Santiago
Great article!! This article will be cited for valuable information about publications. Thanks for valuable data.Posted : Apr 30, 2019 01:23