Collection Rebalance | 2022 Materials Survey
The findings of LJ’s Public Library Materials Survey show that librarians are focused on the formats readers want and the process of crafting responsive and representative collections.
 The findings of LJ’s Public Library Materials Survey show that librarians are focused on the formats readers want and the process of crafting responsive and representative collections
The state of U.S. public library collections in 2022 is in flux, with librarians considering stacks that need to be studied, measured, weeded, and diversified. Our yearly materials survey highlights the demands of readers for a range of formats and the need to ensure that collections reflect voices previously ignored due to racism and other structural biases.
PRINT: THE BACKBONE OF COLLECTIONS
Physical books remained the core of library collections in 2021, accounting for 49 percent of total materials budget expenditures. Defying numerous predictions, materials budgets have not permanently shifted to ebooks, and, in fact, trending shows that the percentage devoted to those resources has fallen since 2020. Comparing the materials allocation breakdowns of the last three years, the portion spent on print books has increased by one percent. Ebooks have settled from their 2020 high of 17 percent—coinciding with library building closures, during which ebooks were often the only option—to 13 percent, just one percentage point higher than before the pandemic began.
 While the allocation of funds paints a clear picture, selectors report a more varied situation when working with readers. Asked if they see patrons shifting from digital reading back to physical materials, developing a preference for digital, or reading both, many librarians reported that readers were taking a hybrid approach, moving between print and digital. A librarian from Ohio wrote that readers maintain this mixed stance even within one reading experience. “I see the patrons reading both physical and digital. Whichever one will come in faster on reserve. I have seen patrons start with the physical book and switch to the ebook when they get it.”
Others reported that readers are returning to print and prefer it, some citing screen strain as a reason to read physical books for leisure. Others note a shift to digital, not on the part of patrons who previously preferred print, but because they gained a new type of patron during the pandemic, an e-only reader who signed up for a library card online and interacts with the library only through its digital services.
Multiple collection development librarians reported that they see a shift to ebooks pending in their budgets and thought 2022 data would be telling.
Of course, this mix creates strain on collection budgets. As one librarian put it, she struggles to “fill the demand for popular titles in both formats, when the wait lists are comprised of unique patrons.” The challenge of meeting demand when holds are not solely organized by title but by patron format preference as well, or when holds queues are filled with hybrid readers waiting for either print or digital copies to arrive, complicates the entire holds fulfillment ecosystem.
|
MATERIALS ALLOCATION COMPARISONS* |
|||
| PERCENTAGE OF MATERIALS BUDGET ALLOCATED TO | 2019 | 2020 | 2021 |
| Books | 48% | 48% | 49% |
| Ebooks | 12% | 17% | 13% |
| Physical audiobooks | 5% | 5% | 5% |
| Downloadable audiobooks | 6% | 7% | 6% |
| DVDs/Blu-rays | 12% | 11% | 9% |
| Music CDs | 2% | 2% | 1% |
| Streaming electronic resources | 3% | 3% | 6% |
| Databases | 8% | 6% | 8% |
| Other | 4% | 1% | 3% |
|
*Different U.S. libraries answered each year |
|||
PHYSICAL MEDIA: CUTS ARE COMING
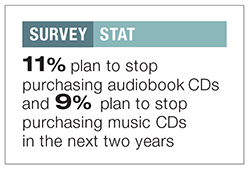
The picture for media collections is clearer: Librarians are seeing a change in patron usage. As Nanette Donohue, Champaign Public Library, IL, states, echoing similar responses, “Most of our customers who went digital for audiobooks are not going back to physical audiobooks. Our usage in that area continues to grow.” Several librarians cited a lack of access to CD players in cars and homes as driving this shift. Eleven percent of libraries that carry audiobooks on CD plan to discontinue buying them over the next 24 months. Budgets have yet to reflect this, however. Spending on downloadable audiobooks is at six percent (one percent lower than 2020) and is now back to its 2019 level, while physical audiobooks have remained flat at five percent over the last three years.
Other physical media are similarly in a downward turn. The proportion spent on physical DVDs has fallen three percentage points since 2019, but only one percent plan to stop purchasing in the next two years. Nine percent of libraries plan to stop buying music on CD over the next two years.
|
PERCENT OF LIBRARIES PURCHASING PHYSICAL MEDIA |
|
| FORMAT | PERCENTAGE |
| DVDs | 97% |
| Audiobooks on CD | 91% |
| Music on CD | 67% |
| Readalong books with audio | 60% |
| Blu-rays | 59% |
| Playaway audio | 43% |
| Vendor-curated "binge boxes" | 27% |
| 4K UHD/Blu-rays | 7% |
| Music on vinyl | 3% |
|
SOURCE: LJ PUBLIC LIBRARY MATERIALS SURVEY 2022 |
|
CHANGE IN SPENDING FROM 2020 TO 2021
We asked respondents to estimate the percent change in spending for certain materials between 2020 and 2021. Not surprisingly, digital materials such as streaming media (+23.5 percent), ebooks (+15 percent), and downloadable audiobooks (+11.8 percent) saw the largest increases. While these percentages may seem unusually high, for some libraries an increase in spending of a few thousand dollars can amount to a large percent change. Spending decreases were greatest for physical media such as music CDs (-14 percent), physical audiobooks (-12.2 percent), and DVDs/Blu-rays (-5 percent).
A quarter of libraries in our sample do not purchase music CDs or streaming media at all. This is especially true for libraries in small towns or rural settings.
|
CHANGES IN SPENDING FROM 2020 TO 2021 |
|
| FORMAT | PERCENTAGE |
| Streaming media | +23.5% |
| Ebooks | +15.0% |
| Downloadable audiobooks | +11.8% |
| Databases | +0.6% |
| Print books | -1.2% |
| Large print | -2.4% |
| DVDs/Blu-rays | -5.0% |
| Physical audiobooks | -12.2% |
| Music CDs | -14.0% |
|
SOURCE: LJ PUBLIC LIBRARY MATERIALS SURVEY 2022 |
|
 STREAMING: BUDGETS AND DISCOVERY
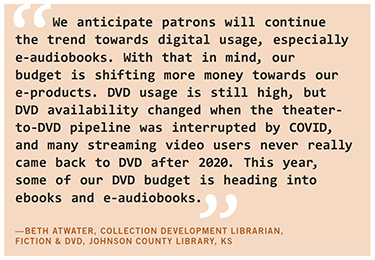
As patrons shift their usage from physical media to streaming, libraries are shifting budgets in response. Spending for those services increased from three percent in 2020 to six percent in 2021. However, that demand creates a strain on budgets. To control and predict costs, libraries are setting limits on usage. Seventy-nine percent report that they cap the number of streams per patron, and 48 percent set controls based on budget limits. Eleven percent use another method to manage costs, such as limiting the titles available by price or removing the highest-priced options. Smaller libraries are more likely to limit the number of streams per patron, and larger libraries are more likely to set caps based on budget limits. Just four percent do not limit usage to manage costs.
Streaming presents another issue: how to support discovery without overwhelming technical services. A third of libraries cope with the huge scale of service-provider metadata by simply not adding it to the catalog, pushing patrons to the digital provider’s site for search and download. Of the remainder, 24 percent load all item records into their catalogs, while 43 percent load select records only. Surprisingly, there is very little difference by library size or metro status across these decisions.
Still another issue with streaming is the general feeling that everything is obtainable. This misconception is leading to disappointment for some patrons. As one librarian told LJ,
“I think, for at least another year with reading materials and for the foreseeable future for media/AV materials, that collection development librarians are going to be trying to find that balance between what patrons want and what we can get them. So many things are exclusive to a streamer or exclusive to a platform, and patrons often don’t understand how it is that the library does not have access, and they get frustrated with us.”
 MEASURING DEMAND AND USE
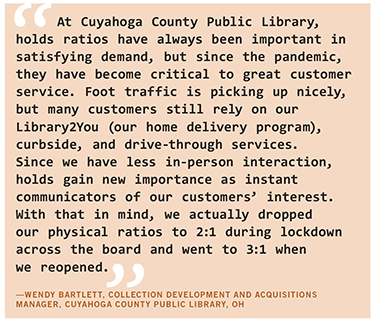
Trying to predict, measure, and meet demand is the ongoing challenge of collection development. To determine the need to purchase an additional copy, most libraries use hold ratios (the number of holds per copy). Libraries set their highest ratios (6:1) for ebooks, downloadable audiobooks, and DVDs/Blu-Rays, while hold ratios for fiction and nonfiction print books are slightly lower. Small town and rural libraries are less likely than suburban and urban libraries to report hold ratios at all; 15 percent of small-town and rural libraries report that they are only able to purchase one copy of a fiction title, regardless of demand.
Fifty-four percent of responding libraries track circulation to determine return on investment. Forty-four percent do not, and five percent use other methods of measurement, including collection management software tools and system reports.
To determine how well a title is performing, some libraries calculate turnover rates (the number of times an item circulates within a set period). DVDs and Blu-rays have the highest turnover rates (7.3), with fiction and downloadable audiobooks expected to perform slightly less well. Of all categories, nonfiction has the lowest average turnover rate expectation (3).
DIVERSITY AUDITS
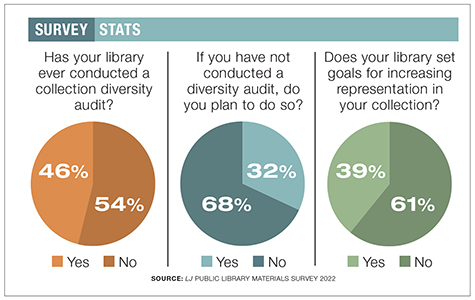
Determining the range and content of materials in the collection, and what may be missing, is critical. Our survey found that 46 percent of respondents have conducted a diversity audit to evaluate holdings.
Of those, 32 percent audited the entire collection. A third (34 percent) singled out the children’s collection, and 21 percent each focused on the adult and YA collections. Only nine percent audited fiction. No respondents reported auditing only the nonfiction collection. To help put that in perspective, more than half (55 percent) of libraries’ total book budgets (including print and digital) is spent on adult books, while the children’s book share averages 31 percent, and YA averages 14 percent.
Diversity audits are twice as likely to have been conducted in the 27 large responding libraries (serving a population of 100,000+) than in the 34 small responding libraries (serving a population of under 25,000). Of those that have not yet conducted a diversity audit, 32 percent are planning to do so. Again, large libraries are the most likely to have such goals.
 Librarians report that adding titles written by members of underrepresented communities is both a personal and a library goal. Thais Rousseau, Capital Area District Libraries, MI, writes that the library’s selectors “complete an in-depth analysis of each branch’s collection for use, trends, gaps, and diversity on [a] regular rotating schedule and are looking to see increases” in materials by and about members of marginalized groups when compared with the previous analysis. The library also measures recommendations to patrons, says Rousseau. “All branches report this data using an audit system we have created.” At least 25 percent of all booklists, displays, and recommendations at the library must now help to increase awareness of materials in the collection that represent racial and other types of diversity. Other librarians shared that they have percentage ordering goals (such as matching the percentage of a population in the area’s demographics, or 30 percent of each monthly title order).
Many reported a deep frustration over how hard it is to find titles to fulfill this aim. As neither jobbers nor publishers (nor, as one selector pointed out, “even Amazon”) make discovery easy, it takes time to research and find titles that meet the necessary criteria, and to discover which publishers/imprints have focused lists. Across several surveys, including the 2021 Readers’ Advisory report, LJ has heard the same complaint; it is difficult to find metadata that makes clear the identification of characters or the self-identification of authors.
This work is both critical and complicated, as identification is a complex concern. As much as metadata is needed, authors may not feel safe or comfortable self-identifying as members of marginalized groups that experience discrimination, and even when they do, nuanced self-identifications do not fit neatly into standard metadata vocabulary.
Even with these challenges, librarians are moving forward. Twenty-two percent of survey respondents have both conducted a diversity audit and set goals for increasing representation in their collection.
WEEDING AND BUILDING
Collections are showing their age in year three of the pandemic. Librarians report that a second collection development priority, following diversity audits, is to weed. One selector wrote that collections “desperately” need it. Another said, “As the pandemic pushed a lot of our patrons towards ebooks and audio, our shelves got full. We are working harder to lure patrons back into our spaces with freshly weeded spaces stocked with high-interest and new-condition inventory. In some ways we’re more concerned with attractive and alluring collections than ever before.” Plans to weed the physical A/V collection were mentioned multiple times, with one librarian planning to reduce its size by half. Others plan to remove outdated nonfiction. With collection maintenance and equity, diversity, and inclusion in mind, librarians also shared the need to refresh all areas of the collection across age groups. Specific aims included building more representative collections overall and acquiring more materials in languages other than English.
T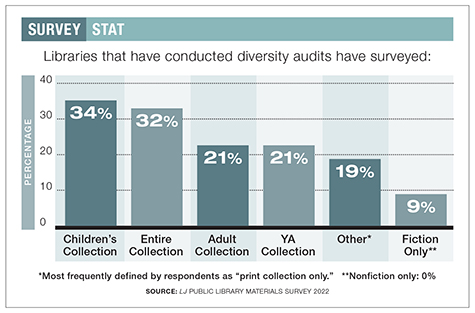 HE WORK OF 2022
LJ ’s 2022 Materials Survey confirms that spending is largely leveling out to pre-pandemic numbers. While still in flux, the divide between print and ebooks is—at least for now—in a hybrid state ,with devoted print readers, devoted e-readers, and those just happy to get a book in either format.
Physical media collections look to be shrinking, but librarians know how long a change in format takes to promulgate across a community. It might be several more years before the habits tested and gained during the pandemic are reflected in more than incremental shifts in spending. As with many things in library policy, doing away with physical media is likely to happen a little at a time, and then all at once.
Librarians are also working to reconnect with readers. As one librarian wrote, “There is an attempt to discover and rediscover patron reading interests, as those have shifted, sometimes wildly, during the pandemic and as a result of visual media. A lot of things are different now, as far as collection development goes, and the effects will be felt for a long time.”
On the leading edge of change is the commitment by librarians to measure and increase the representation of their collections. Readers want vibrant, well-tended collections that reflect the world and expand their experience of it. This is the work of 2022, and every year that follows.
METHODOLOGY
A survey invitation was emailed to a list of collection development librarians on February 25, 2022, with a reminder to nonresponders on March 4. The survey closed on March 16 with 131 U.S. public library responses. The data were hosted, cleaned, and tabulated in-house by LJ research and remain unweighted (except for a question about the breakdown of materials spending, which is compared to previous years’ weighted responses).
If you would like to be included in the development of topics and questions for next year’s survey, or to share ideas on how LJ can improve our coverage of collection development topics, please sign up here.
RELATED
ALREADY A SUBSCRIBER? LOG IN
We are currently offering this content for free. Sign up now to activate your personal profile, where you can save articles for future viewing


Add Comment :-
Comment Policy:
Comment should not be empty !!!