


2018 School Spending Survey Report
Are We There Yet? | Periodicals Price Survey 2022
Two years into the pandemic, only flat budgets and price increases seem predictable.
 Two years into the pandemic, only flat budgets and price increases seem predictable.
Many in libraryland are asking themselves “are we there yet?” as the world adjusts to its third year of living with the coronavirus. But where is “there”? While dropping coronavirus case counts lead to relaxing of restrictions and signal that we could be nearing the end of the COVID-19 pandemic, other events suggest we may be living with uncertainty for some time. Social and political unrest, persistent supply chain issues, the Great Resignation, and rates of inflation not seen since 1982 all threaten a recovering economy.
The serials ecosystem continues to change rapidly, as years of established library workflows and publishing patterns are upended by the accelerating shift to open access (OA) resources. Meanwhile, increased demand for resources that support diversity, equity, and inclusion is leading some libraries and researchers to push publishers to revise their policies and practices to be more intentionally inclusive of authors from underrepresented groups, and to introduce new content focused on these issues. Stagnant budgets and serials price increases seem to be the only constants in an otherwise protean future.
|
AVERAGE 2022 PRICES FOR SCIENTIFIC DISCIPLINES |
|
|
DISCIPLINE |
AVERAGE PRICE PER TITLE |
| Chemistry | $7,014 |
| Physics | $5,587 |
| Engineering | $4,596 |
| Biology | $4,374 |
| Food Science | $3,745 |
| Geology | $3,706 |
| Technology | $3,430 |
| Botany | $2,994 |
| Zoology | $2,883 |
| Geography | $2,666 |
| Health Sciences | $2,600 |
| Agriculture | $2,519 |
| General Science | $2,423 |
| Astronomy | $2,340 |
| Math & Computer Science | $2,322 |
| SOURCE: LJ PERIODICALS PRICE SURVEY 2022 | |
SIGNS OF ECONOMIC RECOVERY
Just over two years into the pandemic, there are signs that its worst impacts on the global economy are beginning to fade. A midyear surge of COVID
cases owing to the Omicron variant resulted in new restrictions and delayed the reopening of establishments in some parts of the country but did not significantly derail economic growth. As the U.S. economy attempts a full reopening, expected growth in 2022 will exceed 4 percent, the unemployment rate will fall to 3.5 percent, and job growth will average roughly 230,000 per month. Despite this strong growth, unemployment remains higher for people of color and for those between the ages of 19 and 44, the two groups most affected economically by the pandemic.
According to the Bureau of Economic Analysis, the real gross domestic product (GDP) increased at an annual rate of 6.9 percent in the fourth quarter of 2021. However, inflation in 2021 spiked to new highs not seen since the 1980s. Over the last 12 months ending in January 2022, the Consumer Price Index (CPI) all items index increased 7.5 percent before seasonal adjustment, the highest in 40 years, as rising energy costs, labor shortages, supply disruptions, and increased demand began to collectively take their toll. While restored supply chains, a return to pre-pandemic spending patterns, and federal interest rate hikes are expected to tamp down inflation somewhat, war in Ukraine could send the global economy on yet another unpredictable course.
At the state level, the National Association of State Budget Officers (NASBO) reported that state general fund spending is projected to grow 9.3 percent in fiscal 2022, including the expenditure of funds from federal stimulus programs. But how much of that funding will trickle down to higher education remains uncertain, as much of the increase was earmarked for areas impacted by the pandemic.
|
TITLES INDEXED IN SCOPUS COST HISTORY BY LIBRARY OF CONGRESS SUBJECT |
|||||||
| SUBJECT | AVERAGE NO. OF TITLES 2020-2022 | CHANGE 2020-2022 | AVERAGE COST PER TITLE 2020 | AVERAGE COST PER TITLE 2021 | % OF CHANGE 2020- 2021 | AVERAGE COST PER TITLE 2022 | % OF CHANGE 2021-2022 |
| Business & Economics | 1,946 | 94 | $1,718 | $1,780 | 4 | $1,765 | -1 |
| Fine Arts | 406 | 26 | 541 | $563 | 4 | 583 | 3 |
| Heath Sciences | 4,780 | 122 | 1,603 | 1,671 | 4 | 1,749 | 5 |
| Humanities | 2,959 | 180 | 503 | 523 | 4 | 542 | 4 |
| Law | 409 | 4 | 703 | 731 | 4 | 752 | 3 |
| Life Sciences | 2,612 | 44 | 2,337 | 2,404 | 3 | 2,490 | 4 |
| Social Sciences | 3,654 | 462 | 1,078 | 1,120 | 4 | 1,157 | 3 |
| STEM | 6,177 | 55 | 2,493 | 2,570 | 3 | 2,673 | 4 |
| TOTAL/AVERAGE | 22,943 | 987 | 1,676 | 1,734 | 3 | 1,795 | 4 |
|
SOURCE: LJ PERIODICALS PRICE SURVEY 2022 |
|||||||
STATE OF HIGHER ED
According to the State Higher Education Executive Officers Association (SHEEOA), the best available evidence suggests that in 35 states, inflation-adjusted higher education tax appropriations declined from 2020 to 2021. After past recessions, state funding has generally declined for several years before picking up again, and a combination of inflation and decreased tuition revenues due to flat enrollment could further exacerbate that decline.
|
COST HISTORY FOR ONLINE TITLES IN CLARIVATE ANALYTICS INDEXES |
||||||
| Subject | Average No. of Titles 2020-2022 | Average Cost Per Title 2020 | Average Cost Per Title 2021 | % of Change 2020-2021 | Average Cost Per Title 2022 | % of Change 2021-2022 |
| Agriculture | 77 | $1,362 | $1,400 | 3 | $1,441 | 3 |
| Anthropology | 33 | 682 | 710 | 4 | 738 | 4 |
| Arts & Architecture | 68 | 583 | 606 | 4 | 625 | 3 |
| Astronomy | 13 | 2,011 | 2,104 | 5 | 2,164 | 3 |
| Biology | 192 | 3,084 | 3,157 | 2 | 3,281 | 4 |
| Botany | 23 | 2,419 | 2,443 | 1 | 2,512 | 3 |
| Business & Economics | 363 | 1,997 | 2,062 | 3 | 2,041 | -1 |
| Chemistry | 70 | 5,818 | 6,026 | 4 | 6,278 | 4 |
| Education | 136 | 1,165 | 1,218 | 5 | 1,278 | 5 |
| Engineering | 190 | 2,645 | 2,715 | 3 | 2,822 | 4 |
| Food Science | 16 | 2,832 | 2,923 | 3 | 2,762 | -6 |
| General Science | 42 | 1,495 | 1,530 | 2 | 1,581 | 3 |
| General Works | 28 | 457 | 483 | 6 | 508 | 5 |
| Geography | 59 | 1,694 | 1,764 | 4 | 1,845 | 5 |
| Geology | 35 | 1,550 | 1,572 | 1 | 1,615 | 3 |
| Heath Sciences | 534 | 2,070 | 2,108 | 2 | 2,184 | 4 |
| History | 253 | 549 | 573 | 4 | 597 | 4 |
| Language & Literature | 364 | 451 | 472 | 4 | 492 | 4 |
| Law | 64 | 645 | 657 | 2 | 715 | 9 |
| Library Science | 30 | 703 | 727 | 3 | 744 | 2 |
| Math & Computer Science | 100 | 1,809 | 1,847 | 2 | 1,905 | 3 |
| Military & Naval Science | 9 | 1,300 | 1,341 | 3 | 1,395 | 4 |
| Music | 40 | 429 | 439 | 2 | 452 | 3 |
| Philosophy & Religion | 173 | 478 | 493 | 3 | 514 | 4 |
| Physics | 97 | 4,438 | 4,551 | 3 | 4,724 | 4 |
| Political Science | 86 | 961 | 986 | 3 | 1,028 | 4 |
| Psychology | 101 | 1,170 | 1,193 | 2 | 1,246 | 4 |
| Recreation | 36 | 910 | 965 | 6 | 1,016 | 5 |
| Social Sciences | 42 | 1,100 | 1,114 | 1 | 1,162 | 4 |
| Sociology | 250 | 1,101 | 1,138 | 3 | 1,173 | 3 |
| Technology | 44 | 2,588 | 2,658 | 3 | 2,649 | 0 |
| Zoology | 58 | 2,952 | 2,957 | 0 | 3,031 | 3 |
| Totals | 3,626 | 1,639 | 1,683 | 3 | 1,735 | 3 |
| SOURCE: LJ PERIODICALS PRICE SURVEY 2022 | ||||||
Higher education enrollment fell to new lows during the spring of 2021 and dropped again in fall of 2021, showing the persistent impact of COVID related disruption. The year 2020 marked the ninth straight year of enrollment declines, with two-year public institutions seeing the biggest drop-offs. The National Center for Education Statistics (NCES) reported that college enrollment was 19.6 million in fall 2018, reflecting a 7 percent decrease from the record enrollment of 21 million in fall 2010. College enrollment is expected to remain below the 2010 record through 2029, the last year for which NCES enrollment projections were developed. Community colleges remain hardest hit (-9.5 percent or 476,000 fewer students), while a strong job market means that fewer will attend college. With the virus triggering a baby bust rather than the expected baby boom, enrollment numbers could continue to remain flat for years to come.
|
COST HISTORY FOR TITLES INDEXED IN ACADEMIC SEARCH ULTIMATE |
|||||||
| SUBJECT | AVERAGE NO. OF TITLES 2020-2022 | CHANGE FROM '20–'22 | AVERAGE COST PER TITLE 2020 ($) | AVERAGE COST PER TITLE 2021 ($) | % OF CHANGE 2020-2022 | AVERAGE COST PER TITLE 2022 ($) | % OF CHANGE 2022 |
| Agriculture | 164 | -2 | 1,740 | 1,809 | 4 | 1,899 | 5 |
| Anthropology | 54 | 0 | 722 | 759 | 5 | 782 | 3 |
| Arts & Architecture | 56 | -1 | 615 | 645 | 5 | 673 | 4 |
| Astronomy | 26 | 0 | 1,064 | 1,077 | 1 | 1,088 | 1 |
| Biology | 428 | -1 | 3,398 | 3,528 | 4 | 3,655 | 4 |
| Botany | 56 | 0 | 1,753 | 1,819 | 4 | 1,864 | 2 |
| Business & Economics | 232 | 3 | 1,182 | 1,237 | 5 | 1,277 | 3 |
| Chemistry | 157 | 1 | 5,786 | 6,017 | 4 | 6,268 | 4 |
| Education | 258 | -1 | 1,068 | 1,127 | 6 | 1,172 | 4 |
| Engineering | 595 | 9 | 3,190 | 3,326 | 4 | 3,479 | 5 |
| Food Science | 35 | 0 | 1,975 | 2,082 | 5 | 2,158 | 4 |
| General Science | 76 | 0 | 1,833 | 1,908 | 4 | 1,964 | 3 |
| General Works | 95 | -1 | 315 | 326 | 4 | 345 | 6 |
| Geography | 91 | -1 | 1,738 | 1,812 | 4 | 1,883 | 4 |
| Geology | 72 | -1 | 2,982 | 3,089 | 4 | 3,214 | 4 |
| Heath Sciences | 1,177 | -2 | 1,819 | 1,895 | 4 | 1,990 | 5 |
| History | 389 | -1 | 518 | 543 | 5 | 564 | 4 |
| Language & Literature | 326 | -3 | 522 | 542 | 4 | 568 | 5 |
| Law | 233 | 6 | 393 | 408 | 4 | 457 | 12 |
| Library Science | 76 | -1 | 776 | 801 | 3 | 823 | 3 |
| Math & Computer Science | 261 | -2 | 2,254 | 2,340 | 4 | 2,437 | 4 |
| Military & Naval Science | 37 | 1 | 700 | 744 | 6 | 772 | 4 |
| Music | 90 | 1 | 238 | 248 | 4 | 257 | 4 |
| Philosophy & Religion | 318 | -2 | 366 | 379 | 3 | 398 | 5 |
| Physics | 181 | 0 | 4,331 | 4,492 | 4 | 4,629 | 3 |
| Political Science | 114 | 1 | 815 | 856 | 5 | 895 | 4 |
| Psychology | 169 | -2 | 1,090 | 1,121 | 3 | 1,179 | 5 |
| Recreation | 38 | 0 | 968 | 1,026 | 6 | 1,083 | 6 |
| Social Sciences | 48 | 0 | 973 | 983 | 1 | 1,031 | 5 |
| Sociology | 348 | 1 | 1,113 | 1,154 | 4 | 1,201 | 4 |
| Technology | 66 | 0 | 2,297 | 2,389 | 4 | 2,429 | 2 |
| Zoology | 115 | -1 | 1,609 | 1,634 | 2 | 1,681 | 3 |
| TOTAL/AVERAGE | 6,381 | 1 | 1,754 | 1,824 | 4 | 1,901 | 4 |
| SOURCE: LJ PERIODICALS PRICE SURVEY 2022 | |||||||
LIBRARY BUDGET DISRUPTIONS CONTINUE
The leading challenge for academic libraries remains budget and funding, with most expecting flat or decreased budgets for the next five years. Staffing shortages are also causing strain.
Although print monograph purchasing has rebounded slightly as colleges and universities returned to on-site learning, the story is different for serials, where most libraries continue to operate under a digital-first acquisition strategy. While the 80/20 rule for serials/monographs spending (80 percent collections spending on serials; 20 percent on monographs) remains the norm for many institutions, interest in content channels beyond the journal and the book—such as streaming media, zines, and open educational resources—means that libraries have proportionally less to spend on serials. And demand for materials published not just about historically underrepresented groups, but by those groups—including self-published materials and those from small, local presses—means that proportionally fewer collection dollars will be directed to traditional publishers.
Nearly half of all community college library leaders reported some level of budget decrease during the current fiscal year. There is no clear trend as to the extent of these cuts, and 47 percent are unsure of how the pandemic will impact their budgets in the long term. Where money is available, there is a strong push for improving access to digital content.
The picture looks slightly rosier for public libraries, many of which reported small budget gains over 2020. But with much of these gains due to federal COVID recovery funds, sustainability is uncertain, and most are choosing to spend more on technology rather than collections.
|
COST HISTORY FOR TITLES INDEXED IN MASTERFILE PREMIER |
||||||
|
Overall price increases for titles in EBSCO Publishing's MasterFILE Premier are expected to be in the 5.5% to 6.0% range for 2023 |
||||||
| NO. OF TITLES 2020–2022 | AVERAGE COST PER TITLE 2020 | AVERAGE COST PER TITLE 2021 | % OF CHANGE 2020–2021 | AVERAGE COST PER TITLE 2022 | % OF CHANGE 2021–2022 | |
| U.S. | 901 | $336 | $352 | 4.9 | $372 | 5.5 |
| Non - U.S. | 205 | $471 | $487 | 3.5 | $520 | 6.7 |
| SOURCE: LJ PERIODICALS PRICE SURVEY, 2022 | ||||||
OA GATHERS STEAM
OA remains one of the fastest growing sub-segments of journals. Delta Think, a scholarly communications–focused consulting firm, estimates that the OA market was worth $1.1 billion in 2021, with OA publications projected to account for 50 percent of the output by 2024 and 50 percent of the revenue by 2039. Projections from other sources, such as education and publishing market research company Simba Information, are not so optimistic, but there is no doubt that OA is the fastest growing segment of scholarly publishing. Large commercial publishers continue to dominate OA publishing while also pursuing virtual reality and artificial intelligence applications in the hopes that they can meet researchers’ needs wherever they are in the research life cycle.
Although Elsevier continued to increase its output of gold OA articles, Springer Nature retained its position as the world’s largest OA publisher, becoming in 2021 the first publisher to immediately publish over 1 million gold OA articles. Springer last year acquired Atlantis Press, an OA publisher specializing in conference proceedings and journals, while Wiley purchased Knowledge Unlatched, a complement to last year’s purchase of Hindawi. Wiley also picked up J&J Editorial and eJournalPress, two companies that specialize in journal management for societies and associations. Such partnerships continue to play a major role in Wiley’s journal business: Simba Information estimates that approximately 50 percent of Wiley’s journal subscription revenue is derived from publication rights owned by professional societies. SAGE signed transformative agreements in Ireland and Canada and partnered with virtual reality platform Bodyswaps to launch a virtual reality resource for health and social care training. In addition to signing transformative agreements with several consortia across Europe, Taylor & Francis launched the Routledge Open Research Platform, its first open research publishing platform for the humanities and social sciences. Taylor & Francis’s OA subsidiary F1000 also announced that its open research platform was available to all disciplines.
With funder mandates such as the UK Research and Innovation’s (UKRI) new open access policy pushing authors towards OA journals, many society publishers and university presses have no choice but to move in the direction of OA. Even larger publishers remain uneasy about the UKRI mandate, with Taylor & Francis noting that it removes the ability for publishers to be remunerated for the considerable amount of work that goes into progressing an article to acceptance. (The Journal Comparison Service being developed by cOAlition S promises to provide more transparency and understanding with regard to publishing costs and fees.) Smaller houses, hesitant to take on management of complex Read & Publish agreements and their associated article processing charges (APCs), may opt to migrate to a Subscribe-to-Open model. Still, the long-term sustainability of OA for society publishers and university presses remains uncertain and, like the large commercial publishers, some are already beginning to pursue additional revenue streams or collaborating to build platforms independent of the big commercial publishing houses. While Cambridge University Press has now inked over 100 transformative agreements, it is also diversifying into course delivery (Cambridge Advance Online) and learning technology (CogBooks). MIT Press launched MIT Open Publishing Services, with a stated goal of “accelerating the shift away from the academy’s growing dependence on large multinational information service providers.”
Ultimately, regional approaches will also be required, and publishers may need to customize their transformative agreements to match the geography of the institution. European countries which operate on a more centralized funding model will continue to sign Read & Publish agreements, while many North American institutions will find APCs unsustainable. Indeed, the OA strategic consultancy Information Power reports that there is sufficient money available in the research system to fully fund open access. But because money to support OA, at least outside of Europe, is often spread across multiple university departments, it is not flowing in ways that facilitate OA agreements. Information Power therefore suggests that such funding be centralized in the university library and that libraries ensure any open access strategy does not overlook smaller, independent publishers. Information Power also notes that OA agreements need to be priced to reflect both teaching-intensive and research-intensive institutions. OA agreements where price is based on article volume may be unsustainable for many research-intensive institutions. Many publishers may end up needing to develop multiple OA models.
2023 FORECAST
|
2023 COST PROJECTIONS FOR TITLES INDEXED IN ACADEMIC SEARCH ULTIMATE |
||||||||
|
Overall price increases for titles in EBSCO's Academic Search Ultimate are expected to be in the 4.0% to 4.5% range for 2023 |
||||||||
| ACADEMIC SEARCH PREMIER |
NO. OF TITLES |
% OF LIST | 2022 AVERAGE COST PER TITLE | % OF COST |
PROJECTED % OF INCREASE |
Projected 2023 AVERAGE COST PER TITLE |
% OF COST |
PROJECTED OVERALL % OF INCREASE |
| U.S. | 2,532 | 40 | $1,475 | 31 | 4.8 | $1,545 | 31 | 4.2 |
|
Non - U.S. |
3,849 | 60 | $2,182 | 69 | 3.9 | $2,267 | 69 | |
| SOURCE: LJ PERIODICALS PRICE SURVEY 2022 | ||||||||
For 2023, the average price increase for periodicals is again forecast to be in the 3–4 percent range, perhaps drifting slightly upward to 4.5 percent. However, while a serial price increase remains assured, it is only April, and much could change before 2023 pricing is finalized. Inflation could drive prices up beyond 4.5 percent, even though publishers have argued in years past that price increases were driven by other pricing factors independent of the CPI.
|
TITLES IN CLARIVATE ANALYTICS INDEXES COST HISTORY BY LIBRARY OF CONGRESS SUBJECT |
|||||||
| SUBJECT | AVERAGE NO. OF TITLES 2020-2022 | CHANGE FROM '20–'22 | AVERAGE COST PER TITLE 2020 ($) | AVERAGE COST PER TITLE 2021 ($) | % OF CHANGE 2020-2022 | AVERAGE COST PER TITLE 2022 ($) | % OF CHANGE 2022 |
| Agriculture | 110 | 1 | 2,314 | 2,399 | 4 | 2,519 | 5 |
| Anthropology | 45 | 0 | 678 | 709 | 4 | 715 | 1 |
| Arts & Architecture | 94 | 0 | 527 | 555 | 5 | 582 | 5 |
| Astronomy | 14 | 0 | 2,243 | 2,277 | 1 | 2,340 | 3 |
| Biology | 377 | -1 | 4,073 | 4,212 | 3 | 4,374 | 4 |
| Botany | 30 | 0 | 2,831 | 2,933 | 4 | 2,994 | 2 |
| Business & Economics | 525 | 5 | 2,060 | 2,135 | 4 | 2,138 | 0 |
| Chemistry | 141 | 0 | 6,465 | 6,729 | 4 | 7,014 | 4 |
| Education | 161 | 0 | 1,301 | 1,366 | 5 | 1,438 | 5 |
| Engineering | 320 | 0 | 4,189 | 4,355 | 4 | 4,596 | 6 |
| Food Science | 20 | 0 | 3,573 | 3,729 | 4 | 3,745 | 0 |
| General Science | 53 | 0 | 2,247 | 2,323 | 3 | 2,423 | 4 |
| General Works | 68 | -1 | 291 | 299 | 3 | 307 | 3 |
| Geography | 83 | -1 | 2,451 | 2,545 | 4 | 2,666 | 5 |
| Geology | 58 | -1 | 3,433 | 3,548 | 3 | 3,706 | 4 |
| Health Sciences | 980 | 3 | 2,365 | 2,468 | 4 | 2,600 | 5 |
| History | 330 | 1 | 547 | 573 | 5 | 595 | 4 |
| Language & Literature | 442 | 3 | 490 | 511 | 4 | 534 | 4 |
| Law | 101 | 5 | 514 | 526 | 2 | 583 | 11 |
| Library Science | 41 | -1 | 998 | 1,025 | 3 | 1,073 | 5 |
| Math & Computer Science | 142 | 0 | 2,221 | 2,250 | 1 | 2,322 | 3 |
| Military & Naval Science | 13 | 0 | 1,239 | 1,286 | 4 | 1,359 | 6 |
| Music | 56 | 1 | 380 | 394 | 4 | 408 | 3 |
| Philosophy & Religion | 200 | -1 | 481 | 498 | 4 | 520 | 4 |
| Physics | 150 | -1 | 5,280 | 5,409 | 2 | 5,587 | 3 |
| Political Science | 94 | 0 | 1,088 | 1,123 | 3 | 1,182 | 5 |
| Psychology | 150 | -1 | 1,306 | 1,341 | 3 | 1,408 | 5 |
| Recreation | 41 | 0 | 1,013 | 1,070 | 6 | 1,137 | 6 |
| Social Sciences | 59 | 0 | 1,120 | 1,139 | 2 | 1,187 | 4 |
| Sociology | 292 | 1 | 1,290 | 1,334 | 3 | 1,387 | 4 |
| Technology | 58 | 0 | 3,274 | 3,404 | 4 | 3,430 | 1 |
| Zoology | 70 | -1 | 2,770 | 2,777 | 0 | 2,883 | 4 |
| TOTAL/AVERAGE | 5318 | 11 | 2,135 | 2,213 | 4 | 2,303 | 4 |
| SOURCE: LJ PERIODICALS PRICE SURVEY 2022 | |||||||
All players in the serials marketplace—libraries, publishers, and vendors—may see themselves as passengers on a mystery flight: A landing is not in doubt, but when and where the flight will land is anyone’s guess. Social and political instability, inflation, economic uncertainty, and the ongoing shift to open access purchasing models continue to make it difficult for libraries and publishers to plan budgets strategically. Rising journal prices and flat budgets may be the only things many will feel comfortable predicting.
|
2023 COST PROJECTIONS BY BROAD SUBJECT |
|||||||||
| NO. OF TITLES 2022 |
% OF LIST | COST 2022 |
% OF COST | AVG. COST PER TITLE 2022 |
PROJECTED % OF INCREASE 2023 |
PROJECTED COST 2023 |
% OF COST | PROJECTED OVERALL % INCREASE | |
| ARTS AND HUMANITIES CITATION INDEX | |||||||||
| U.S. | 409 | 33 | $120,782 | 0 | $295 | 3.5 | $125,010 | 19 | 4.3 |
| INTERNATIONAL | 819 | 67 | 503,621 | 81 | 615 | 4.5 | 526,284 | 81 | |
| SOCIAL SCIENCES CITATION INDEX | |||||||||
| U.S. | 805 | 42 | 873,038 | 29 | 1,085 | 5.3 | 919,309 | 30 | 2.8 |
| INTERNATIONAL | 1,125 | 58 | 2,133,621 | 71 | 1,897 | 1.8 | 2,172,026 | 70 | |
| SCIENCE CITATION INDEX | |||||||||
| U.S. | 935 | 43 | 3,160,760 | 37 | 3,380 | 5.3 | 3,328,280 | 37 | 4.5 |
| INTERNATIONAL | 1,225 | 57 | 5,457,683 | 63 | 4,455 | 4.0 | 5,675,990 | 63 | |
| PROJECTED OVERALL INCREASE FOR ALL TITLES IN CLARIVATE ANALYTICS INDEXES: 4.1% | |||||||||
SOURCE: LJ PERIODICALS PRICE SURVEY 2022 |
|||||||||
VALUE OF JOURNALS
Journal price data is important for budget management processes, but price alone is not the sole factor determining value. Metrics such as Impact Factor are important in assessing value, and similar metrics will only increase in importance in the future. Improvements in usage data gathering (Counter 5) may provide more data that could be used to help make qualitative assessments of scholarly publishing. Data-based decisions will be very important in determining values as libraries actively manage their information resources.
There are flaws in the Impact Factor, but nothing else has arisen to replace it. This year the survey continues to work with pricing data collected for this article to explore the relationship between prices and metrics such as Impact Factor, Eigenfactor, and Article Influence Score. The relationship between serial prices and citations was explored, with interesting results.
|
COMPARISON OF AVERAGE PRICE OF TITLES IN SCOPUS GROUPED BY PRICE TO IMPACT FACTOR, ETC. |
||||||
| PRICE BAND | NO. OF TITLES | AVERAGE PRICE 2022 | % PRICE INCREASE 2021–22 | AVERAGE LATEST IMPACT FACTOR | AVERAGE EIGENFACTOR | AVG. COST PER CITATION |
| Less than $646 | 2,933 | $361 | 2.2 | 2.13 | 0.4271 | $0.15 |
| Between $646 and 1,275 | 3,132 | 933 | 4.1 | 2.84 | 0.8388 | 0.23 |
| Between $1276 and 2,177 | 2,559 | 1,676 | 5.2 | 3.67 | 1.7316 | 0.21 |
| Between $2178 and 4,546 | 2,541 | 3,140 | 4.7 | 4.59 | 2.6323 | 0.24 |
| Greater than $4,456 | 1,990 | 8,539 | 4.2 | 4.87 | 4.4959 | 0.34 |
SOURCE: LJ PERIODICALS PRICE SURVEY 2022 |
||||||
To examine the relationship between price and value, the titles in the Scopus index for 2022 were divided into broad price categories. The selection of categories was based on median prices with standard deviations, and those price bands remain in use for comparison. The average for Impact Factor and Eigenfactor, for all titles in a price range, was compared to the averages in the other price bands. The results are displayed in Table 5. All value metrics tended to increase with the increase in price. However, this increase was significantly less than the increase in price.
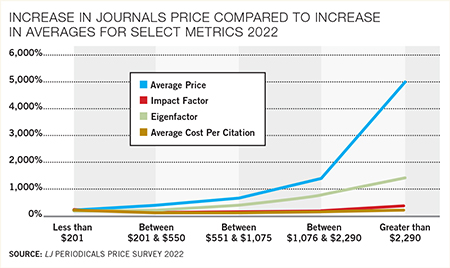
Although there were increases in the metrics for Impact Factor and Eigenfactor, the increases were not comparable to the increase in price. The average price ($8,539) for the most expensive journals was 24 times higher than the least expensive ($361) journals, while the Impact Factor slightly more than doubled. The price increases for the more moderately priced titles were consistent with the more expensive titles, which showed close to a 4 percent increase. This analysis continues to show that higher priced titles have higher Impact Factors and Eigenfactors, but the increase in the metrics is small when compared with the huge increase in costs.
The ratio of citations to serial costs by subject is reviewed in Table 6. For STM journals, average prices tend to be high in comparison to other subjects. This scenario changes if the costs are divided by the numbers of citations. Chemistry has the highest average price, but the sixth lowest cost per citation. If citations are considered an indicator of value, then chemistry journals, despite high average prices, are high-value journals. Conversely, journals in philosophy, music, and history are relatively cheap but infrequently cited, so journals in those areas show the highest cost per citation.
|
COMPARISON OF SERIAL PRICES WITH CITATIONS BASED ON TITLES IN SCOPUS |
||||
| SUBJECT | NO OF TITLES 2022 |
TOTAL COST 2022 |
TOTAL CITATIONS | COST PER CITE |
| General Science | 209 | $411,284 | 7,361,023 | $0.06 |
| Psychology | 380 | 497,829 | 2,572,113 | 0.19 |
| Health Sciences | 3,300 | 7,217,393 | 35,333,371 | 0.20 |
| Geology | 1,144 | 4,015,904 | 18,393,347 | 0.22 |
| Chemistry | 201 | 591,385 | 2,404,927 | 0.25 |
| Physics | 398 | 2,295,402 | 9,218,604 | 0.25 |
| Food Science | 1,142 | 4,455,038 | 17,530,982 | 0.25 |
| Biology | 48 | 181,646 | 709,784 | 0.26 |
| Engineering | 437 | 2,084,866 | 7,319,920 | 0.28 |
| Agriculture | 122 | 270,625 | 941,745 | 0.29 |
| Geography | 342 | 752,698 | 2,612,049 | 0.29 |
| Botany | 253 | 511,803 | 1,730,089 | 0.30 |
| Astronomy | 222 | 686,770 | 2,188,129 | 0.31 |
| Technology | 24 | 9,844 | 30,931 | 0.32 |
| Recreation | 44 | 96,374 | 279,963 | 0.34 |
| Business & Economics | 674 | 931,130 | 2,529,769 | 0.37 |
| Sociology | 1,256 | 2,566,346 | 6,763,514 | 0.38 |
| Zoology | 110 | 131,473 | 340,845 | 0.39 |
| Library Science | 92 | 83,608 | 195,645 | 0.43 |
| Education | 223 | 497,336 | 1,100,149 | 0.45 |
| Political Science | 209 | 237,958 | 517,200 | 0.46 |
| Social Sciences | 386 | 512,438 | 1,105,304 | 0.46 |
| Anthropology | 149 | 170,007 | 344,136 | 0.49 |
| Math & Computer Science | 101 | 130,522 | 259,322 | 0.50 |
| General Works | 236 | 132,202 | 259,879 | 0.51 |
| Military & Naval Science | 580 | 1,371,540 | 2,661,484 | 0.52 |
| Law | 38 | 54,165 | 90,459 | 0.60 |
| Language & Literature | 378 | 313,446 | 447,457 | 0.70 |
| Arts & Architecture | 37 | 49,483 | 67,732 | 0.73 |
| History | 295 | 267,125 | 353,922 | 0.75 |
| Music | 22 | 18,908 | 22,272 | 0.85 |
| Philosophy & Religion | 59 | 59,582 | 59,443 | 1.00 |
| TOTAL/AVERAGE | 13,111 | 31,606,128 | 125,745,509 | 0.25 |
SOURCE: LJ PERIODICALS PRICE SURVEY 2022 |
||||
It is not surprising that commercial publishers have higher per citation costs than other types of publishers. Commercial publishers showed a cost per citation of 31¢ and an average price of $2,646, while university presses showed 12¢ and an average price of $718, and societal publishers showed 6¢ and an average price of $1,620.
METHODOLOGY
The price survey, except for Table 3, uses a print-preferred pricing model based on the standard retail price for the titles in the selected indexes. Print pricing is used for consistency because not all publishers make their online-only pricing available
or have a standard online-only retail price. The index contains pricing for print + online and online-only, but only if those were the only rates offered. When all
the data is reviewed, print-only pricing is now only 28 percent of the data used in these tables, so despite difficulties getting online pricing, most journals are shifting to some form of online for their pricing, reflecting the continuing decline in print. Where there are different tiers for online prices, the lowest tier was used for
the data.
The survey uses a combination of title sets to provide different views of the impact of inflation on libraries. Titles indexed in the Clarivate Analytics Citation Indexes (Arts and Humanities, Science, and Social Sciences) and the titles from SCOPUS provide data that is useful for large academic libraries. The data from these indexes is sorted by discipline and as well as by format, online vs print. Titles indexed in EBSCO’s Academic Search Ultimate database represent the titles most held in general academic and public library collections. Titles from EBSCO’s MasterFILE Premier are included to provide a data set that would be germane to smaller public and school libraries.
TABLE 1 The average price ($7,014) for chemistry titles rose 4 percent over last year. There were only slight shifts in relative rankings for other science, technology, and medicine (STM) subject areas. Content from the five major publishers—Elsevier, Springer Nature, Wiley, Taylor & Francis, and SAGE—continues to represent more than half (56 percent) of the titles in the merged Clarivate Analytics Indexes but make up close to 76 percent of the dollar value.
TABLE 2 This is the largest sample used in the price studies (22,943 priced titles) and the larger data set makes results more reliable. SCOPUS data showed a 4 percent increase for 2022.
TABLE 3 Table 3 examines the titles in the combined Clarivate Analytics Citation Indexes (Arts and Humanities, Science, and Social Sciences) that offer published rates
for online formats. As in Table 1, STM titles have the highest average cost, with chemistry leading the pack. The 2022 average cost was $1,735. This was a 3 percent increase over 2021. Prices are lower in this sample, as many of the large publishers use custom quotes for online prices. Consequently, some high price journals are not in the mix.
For comparison purposes, the rate of price increase is analyzed for approximately 7,300 e-journal packages handled by EBSCO Information Services. Packages are a large part of the periodicals marketplace, so the rate of price increase for these types of subscriptions is important data. For 2022, the average rate of increase was 3.2 percent, up a little more than one percentage point from 2.12 percent in 2021.
Stephen Bosch is Materials Budget, Procurement, and Licensing Librarian, University of Arizona Library, Tucson. Barbara Albee is Account Services Manager, EBSCO Information Services. Sion Romaine is Director of Acquisitions & Rapid Cataloging Services at the University of Washington Libraries.

Added To Cart
RELATED


RECOMMENDED


TECHNOLOGY

ALREADY A SUBSCRIBER? LOG IN
We are currently offering this content for free. Sign up now to activate your personal profile, where you can save articles for future viewing
ALREADY A SUBSCRIBER? LOG IN
Thank you for visiting.
We’ve noticed you are using a private browser. To continue, please log in or create an account.

Add Comment :-
Comment Policy:
Comment should not be empty !!!