


2018 School Spending Survey Report
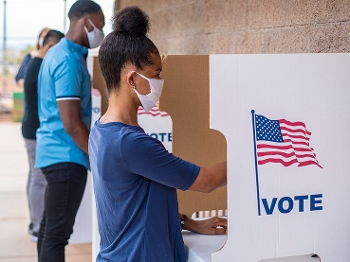
The Price of a Pandemic | Budgets and Funding 2021
Budgets, modestly up, reflect pre-COVID planning, but how they’re spent has changed drastically: Circ, hours, and staffing see major pandemic drops while tech, e-content, and safety spending rise.
 Budgets, modestly up, reflect pre-COVID planning, but how they’re spent has changed drastically: Circ, hours, and staffing see major pandemic drops while tech, e-content, and safety spending rise.
The numbers for 2020 tell the story of a challenging year. With the North American onset of the coronavirus in February and closures of library buildings, moves to virtual programming, a flood of furloughs and layoffs, and reopenings then dialed back with a new wave of infections, libraries were forced to contend with a ripple effect of changes throughout and beyond their systems.
LJ’s 2021 Budgets and Funding survey received responses from 363 public libraries across the United States—the largest response since 2017. Budgets were largely set prior to the disruptions of the pandemic, and thus don’t reflect the belt-tightening that we will most likely see in next year’s survey—total operating budgets were up 2.9 percent, materials budgets rose by .5 percent, and personnel budgets increased by 3.1 percent.
However, circulation, open hours, and staffing have been severely affected by the COVID crisis. As of December 16, 2020, 72 percent of respondents reported decreased open hours, more than 39 percent said that FTE staffing had decreased in the past year, and 87 percent predicted a drop in circulation this year.
Given the challenges they face, many responding libraries were cautiously optimistic, predicting relatively small budget contractions in 2021. Even so, LJ’s survey paints a picture of great change in the landscape—one that libraries will continue to contend with for years to come.
SHIFTING LINE ITEMS
While the 2.9 percent average increase in total operating budgets is the same as last year’s, the distribution tells a different story. In 2020, 63 percent of libraries reported an increase in their total operating budget, as opposed to the previous year’s 84 percent, and 30 percent claimed a decrease in operating budgets, in contrast to 14 percent in 2019. Reports of decreases across all budgets were also up from last year.
Materials budgets as a whole saw only a slight increase of 0.5 percent, a sizable step down from last year’s 2.2 percent gains—although per capita materials funding, at an average of $6.41, was the highest recorded since LJ began tracking it in 2011, coming in at 6.8 percent higher than the previous year. Public libraries devoted an average of 11.2 percent of their total operating budget to materials last year. (For more on materials, see LJ’s annual Materials Survey.)
Per capita circulation in 2019, the last complete year assessed, was 8.68 items, including both print and digital materials. Numbers were highest in Midwestern and suburban libraries, with about 10 to 11 items circulated per person. Over the past decade, per capita circulation has shown a general downward trend.
Despite the adoption of curbside pickup, home deliveries, and areas of the library set apart for browsing, as well as the uptick in digital borrowing, predictions for circulation numbers through the end of 2020 are notably low. These are consistent across library size and region, with 87 percent of libraries expecting a drop in circ—2020 circulation is predicted to be almost 30 percent lower than in 2019.
STEPPING UP TECH, OUTREACH
Although spending on technology was already a priority, it was apparent from the beginning of the pandemic that serving patrons remotely would be critical. Libraries that had not previously invested in remote programming, or that had just begun to explore the possibilities, were forced to up their games on short notice. Respondents spent an average of $294,400 on technology in the last fiscal year, nearly half—44 percent—noting that this was an increase over last year.
An estimated 26 percent of material spending went toward digital materials, up from 20 percent last year, and nearly two-thirds—63 percent—stated that the percentage allocated for digital materials increased over the last year. On average, the net change in digital spending rose by 11.7 percent, with suburban and urban libraries allocating the most to digital materials. Unsurprisingly, a majority of libraries shifted purchasing dollars during the pandemic, spending more on digital resources (81 percent) and technology (61 percent).
With new emphasis on digital collections, some feel they’re spending more and getting less. From March to August, says Amy Grasmick, director of the Kimball Public Library, VT, “circulation of e-content increased by 48 percent over the same period in 2019, while circulation of the physical collection decreased by 35 percent—and we offered curbside service with only a one-week interruption after we closed in March. We’re absolutely serving a smaller segment of the community while spending a whole lot more money, thanks to the astronomical prices for, and draconian lease limits on, e-content.”
Outreach spending grew as well, with 14 percent of libraries increasing such expenditures in the last year. The larger the library, the more likely it was to spend on outreach. More libraries reported a decrease in programming spending, with only 27 percent stating that the average amount spent on programming grew in 2020.
STAFFING SHAKE-UPS
The pandemic saw boards and directors forced to make hard calls about which workers could be kept on payroll as much face-to-face, frontline work was put on hold when facilities closed their doors. Ten percent of responding libraries have staff members currently furloughed, at an average of 13.2 FTE. Larger systems, with more workers as a whole, were more inclined to have layoffs and furloughs.
While 71 percent of responding libraries reported an increase in personnel budgets for FY20, over the last 12 months 39 percent of libraries experienced staffing decreases, while just over half—52 percent—say it stayed level. Even without taking furloughs into consideration, the average number of current FTE for 2020 was 56.7, down by 2.8 from 2019.
Libraries spent an average of $70,573 per FTE, including FICA and benefits, in 2020. Personnel budgets, which gained a robust 4.3 percent in 2019, rose only 3.1 percent.
COVID CHANGES
With children, teens, and college students shifting to distance learning, and many adults teleworking, a majority of libraries noted that they felt pressured to fill gaps in services formerly offered by schools, colleges, offices, and other providers whose locations closed. These include boosting Wi-Fi services beyond the library building (71 percent), meeting increased demand for Wi-Fi hot spot devices (56 percent), and purchasing more digital materials for children (60 percent).
As libraries offered curbside and delivery services, or opened locations on a limited basis, nearly all (97 percent) reallocated some part of their budget to personal protective equipment (PPE) and safety materials. Additional cleaning supplies, janitorial services, and security were often needed. Interior redesigns proved necessary as well, to accommodate social distancing requirements. Many developed outdoor program spaces. Indoors, libraries erected Plexiglas and plywood partitions, provided signage, installed touchless self-check centers, and revamped their HVAC systems, all of which came with unanticipated price tags.
More money went to technology and digital resources, leaving less for print resources—84 percent moved funds away from physical books and periodicals during the pandemic—and workers, with 63 percent of libraries reporting allocations shifted away from staffing once the pandemic hit, even though personnel budgets had risen across the board. Nearly half reported spending on work-from-home expenses for staff, such as computer equipment and software.
Of all the measures, open hours were likely the hardest hit by the pandemic. The current average open hours per library location is 34.6 per week, significantly down from last year’s reported 51.7. Among the nearly three-quarters of libraries that reported cutting open hours, this translated to a net decrease of 13.7 hours per week per location.
Between November 10, 2020, when the survey posted, and when it closed on December 16, 42 percent reported offering limited browsing and computer use, with 24 percent open for holds pickups but not browsing—in urban libraries, this number shot up to 43 percent. Thirty percent are open for regular in-person service, mostly in the South and Midwest, and mainly rural libraries. A few—5 percent—are not open to the public at all and offer online service only. The survey’s mid-December cutoff means that results don’t reflect libraries that have had to shutter facilities since then in reaction to the recent wave of
COVID infections.
|
CIRCULATION, HOURS, AND STAFFING CHANGES FROM 2019 TO 2020 |
|||
| CHANGE IN CIRCULATION | % CHANGE IN WEEKLY OPEN HOURS |
% CHANGE IN FTE STAFFING |
|
| Increase | 7 | 2 | 9 |
| Decrease | 87 | 72 | 39 |
| No Change | 6 | 26 | 52 |
| Overall % change | -29.6 | -13.7 hours per location |
-2.8 FTE |
|
SOURCE: LJ BUDGETS & FUNDING SURVEY 2021 |
|||
FUNDING SOURCES
In 2020, almost two-thirds (64 percent) of the libraries surveyed were subject to local budget appropriations, with 28 percent funded through a library district.
As in previous years, those libraries with dedicated independent taxing districts showed a distinct advantage, seeing stronger funding across the board as real estate remained relatively stable and ballot measures did well in November (see “Libraries on the Ballot” for more information). Independent district–based libraries averaged operating budgets of $9.6 million in 2020, while those subject to local appropriation saw budgets that averaged 36 percent less, at $6.2 million. The net increase in local appropriation funding from 2019 to 2020 averaged 1.8 percent, a significant drop from the previous year’s 5.1 percent growth.
Although 44 percent of libraries reported that state funding remained stable over the past year, the overall net change was down 2.7 percent from 2019, with the largest drop (5.3 percent) in the South. Overall, Midwestern libraries came out relatively well, with a decrease of only 0.7 percent.
Per capita total funding showed the difference between sources as well, with independent districts averaging $75.20 a head and those reliant on government appropriations averaging $48.20. In addition, independent taxing districts were able to spend an average of $2.82 more per person on materials than libraries beholden to local government appropriations.
EveryLibrary Executive Director John Chrastka notes that libraries dependent on municipal revenue streams—taxes on consumer spending, travel, and even gambling—can expect harder times ahead. “Unless things change under the Biden administration, municipalities are going to be suffering, and therefore libraries as a department of government will be suffering,” he says. “States will be suffering, and therefore our state libraries and the state aid formula that supports public libraries will suffer.”
While taxpayer support for libraries was strong in 2020, the pandemic will likely impact the ability of many homeowners and businesses to make payments this year. Even libraries in stable taxing districts, adds Chrastka, will be affected by the shortfalls of a municipally funded library in the next county or district. “And if housing values collapse, all bets are off.”
When asked to forecast what budgets may look like in 2021, libraries funded through independent districts predicted a 0.9 percent increase. And while variables are myriad—including how and when the pandemic will be mitigated and what forms of economic relief legislation are enacted—government-funded libraries, 38 percent of which saw an increase in total funding for 2020, predict average budget decreases of 1.4 percent.
In the private sector, grant funding increased by 2.8 percent since 2019, but donations were down by 5.3 percent—perhaps an indication of tighter budgets at the individual and corporate level as well. Northeastern libraries fared most poorly when it came to donations in the past year, and were the only region to see a decrease in grant money.
|
CHANGES FROM 2019 TO 2020 |
|||
| % TOTAL OPERATING BUDGETS |
% MATERIALS BUDGETS |
% PERSONNEL BUDGETS |
|
| Increase | 63 | 45 | 71 |
| Decrease | 30 | 38 | 24 |
| No Change | 7 | 17 | 5 |
| Overall % change | 2.9 | 0.5 | 3.1 |
|
SOURCE: LJ BUDGETS & FUNDING SURVEY 2021 |
|||
EYES ON 2021
Projections for 2021 are cautious, with library leaders anticipating a basically flat total operating budget dip of -0.5 percent.
Coronavirus Aid, Relief, and Economic Security (CARES) Act funding expired at the end of 2020, and until the next relief package is enacted, libraries are looking at fundraising options and considering where they can find saving opportunities. Much will depend on how the Biden administration approaches economic relief on a national basis, and how much of that will trickle down to libraries.
Mid-size libraries, serving populations of 25,000–49,000, predict the most severe budget decreases next year, at -3.2 percent; those serving the smallest and largest populations were pessimistic as well, forecasting average drops of -2.1 percent and -2.2 percent respectively. The outliers were libraries with service areas of 100,000–499,000, which anticipated a 1.3 percent boost in budgets, and libraries in the Midwest, nearly half of which anticipated a positive change.
As budgets are set later this year, Chrastka warns of austerity scenarios, where libraries are in competition with other municipal departments. “If a library has not been properly positioned to demonstrate its value—not just talk about how great they are but actually measure their outcomes—they’re going to have a hell of a time in an austerity budget,” he says (see “How To Fight an Austerity Budget and Advocate for Your Library in the Age of COVID-19”). Whether advocating for their budgets to city council or going to the polls in 2021, Chrastka advises libraries to make a case not only for how well or quickly they pivoted during the pandemic, but also how they’re serving their community. “What are you doing for humans who are in need right now? If you can’t demonstrate that you’ve done that, now’s the time to start quickly collecting [outcomes] from the last quarter of last year.”
Libraries should also step up alliances with other agencies, he says. “Get out of your own silo, because otherwise you’re going to be pitted against each other by budgetary constraints. You have to have better relationships and better partnerships to weather this.”
Sixty-one percent of libraries feel that some of the budgetary shifts they saw in 2020 will be permanent, even after a vaccine is implemented and the pandemic is mitigated. Some made permanent physical changes that will get factored into next year’s budget, or have taken on more real estate for additional space. Others simply don’t anticipate recovering from this year’s cuts. “We will never return to previous staffing levels or number of service hours,” predicts Sharon Rowe, library manager at the Alamogordo Public Library, NM.
The changes are not all negative, however—a number of libraries permanently eliminated overdue fines in 2020. And nearly all believe that online programming and an increased emphasis on digital materials will continue, especially as patrons become more comfortable using the technology, and plan to factor that into line items in 2021. “I don’t think we can start a service and discontinue it,” notes Maria Redburn, director of the Bedford Public Library, TX.
Whatever changes remain, libraries—and the world—are bracing for a deeply uncertain future. Many will be doing more with less, or taking a close look at what can be cut from already tight budgets. And nearly all will be implementing some version of the strategy outlined by Garland County Library, AR, Director Adam Webb—“Just trying to find all the coins in the couch cushions.”
For more information on the survey, or to view the data segmented by population served, access the complete 2020 public library budget survey report.

Added To Cart
RELATED


RECOMMENDED


TECHNOLOGY

ALREADY A SUBSCRIBER? LOG IN
We are currently offering this content for free. Sign up now to activate your personal profile, where you can save articles for future viewing
ALREADY A SUBSCRIBER? LOG IN
Thank you for visiting.
We’ve noticed you are using a private browser. To continue, please log in or create an account.

Add Comment :-
Comment Policy:
Comment should not be empty !!!