


2018 School Spending Survey Report
Costs Outstrip Library Budgets | Periodicals Price Survey 2020
Higher education continues to grapple with an uncertain future of flat or declining student enrollment and mounting financial pressures. Library budgets are for the most part flat or diminishing, leaving libraries to yet again battle the terrible twins of cost inflation and revenue stagnation. Many libraries are cutting continuing expenditures by cancelling or breaking up journal packages and buying only those titles for which use or demand justifies the price. Others are aggressively renegotiating contracts with publishers to reduce ongoing costs.
New approaches have emerged, but none offer a solution to serial costs continuing to rise higher than library budgets
“Follow the money,” a catchphrase used in politics and investigative journalism, suggests that understanding the way campaign cash flows sheds light on the way the political winds blow. Applied to the periodicals market, following the money reveals trends in the publishing industry, higher education, and library collection development.
Higher education continues to grapple with an uncertain future of flat or declining student enrollment and mounting financial pressures. Library budgets are for the most part flat or diminishing leaving libraries to yet again battle the terrible twins of cost inflation and revenue stagnation. Many libraries are cutting continuing expenditures by cancelling or breaking up journal packages and buying only those titles for which use or demand justifies the price. Others are aggressively renegotiating contracts with publishers to reduce ongoing costs.
Still others are turning to Open Access (OA) to freely distribute research outputs to all. But while it shifts the cost from readers’ institutions to researchers’, OA is not free. Of the multiple OA models that have taken root, none offer a solution for content costs that outpace library budget increases.
ECONOMIC CONTEXT
U.S. economic growth remained stable this year. According to the Bureau of Economic Analysis, the gross domestic product increased at an annual rate of 2.3 percent in 2019 compared to 2.9 percent in 2018. Total state spending grew moderately: The National Association of State Budget Officers reported that total state spending rose by 5.7 percent in FY2019, compared to 3.4 percent in FY2018. Comparably, from January 2019 to January 2020, the Consumer Price Index for All Urban Consumers rose 2.5 percent, suggesting that state budgets have begun to stabilize after years of cuts. Compared with the outlook in 2010, the nation’s projected long-term finances have improved, largely due to significant reductions in prospective health care cost growth and low interest rates.
Despite a stable economy and an improving state budget outlook, higher education continues to grapple with the challenges of increased costs, shaky funding, and declining enrollments. A January 2020 Chronicle of Higher Education (CHE) article states American colleges saw a 2.5 percent increase in costs during 2019 compared to 2.8 percent in 2018. Similarly, a CHE 2019 roundtable report, Beyond Budgets, states that higher education faces several financial challenges as public investment and tuition revenue are on the decline while labor and facility costs continue to rise.
The State Higher Education Executive Officers (SHEEO) annual finance report for 2018 shows that ten years after the start of the Great Recession, state funding for higher education has only partially recovered. Progressive and conservative think tanks agree that state funding for higher education remains volatile year over year, but disagree over the impact of that volatility and over whether state funding for higher education has decreased or remained stable over time. The Center on Budget and Policy Priorities reported in 2019 that deep state cuts in funding for higher education since 2008 have contributed to rapid, significant tuition increases and pushed more of the costs of college to students, making it harder for them to enroll and graduate. Conversely, the Texas Public Policy Foundation reported that, when inflation is considered, higher education spending per student is higher now than it was in 1980. Regardless, SHEEO notes that swings in state funding can highly stress institutional budgets and that net tuition revenue is higher now than at any point since 1980, in part because state funding declines are the biggest cause of tuition increases.
Enrollment is expected to remain flat or decrease through at least 2027, and the Centers for Disease Control and Prevention reports that U.S. births fell to a 32-year low in 2018. National Student Clearinghouse Research Center Current Term Enrollment - Spring 2019 found that overall post-secondary enrollments decreased 1.7 percent from the previous spring. The National Center for Education Statistics (NCES) Integrated Postsecondary Education Data System updates on 2019 enrollment show that about 19.9 million students will attend colleges and universities in fall 2019, about 5 percent lower than the peak of 21 million in fall 2010.
Both Simba Information and NCES sources indicate that degree-granting higher education institutions are continuing to decline in number, either through closure or consolidation. The number of Title IV institutions dropped from 6,642 in 2017/2018 to 6,281 in 2018/2019, with private institutions seeing the greatest drop in numbers, making the financial situation even more dire for higher education.
LIBRARY ECONOMIC OUTLOOK
For the most part, a decade of U.S. economic growth has not trickled down to academic library collection budgets. Although spending on higher education has improved since the Great Recession, many institutions are not funding their libraries to the same extent as in previous years, and many libraries are opting to allocate their moderate budget increases to new services rather than collections.
The 2018 Association of College and Research Libraries (ACRL) Academic Library Trends and Statistics, published in July 2019, reported that library expenditures for collection materials averaged $5.3 million for doctoral degree-granting institutions; $684,000 for comprehensive degree-granting institutions; $498,000 for baccalaureate schools, and $196,000 for associate-degree granting institutions. On average, doctoral degree-granting institutions spent 77.2 percent of their materials budgets on ongoing commitments to subscriptions in 2017; comprehensive schools spent an average of 82.4 percent; baccalaureate schools spent an average of 79.5 percent, and associate degree-granting institutions spent an average of 64.9 percent. On average, academic libraries spent 76 percent of their materials budget on ongoing subscriptions.
The picture is slightly better for public libraries. Library Journal’s 2019 Budgets and Funding survey of U.S. public libraries shows that total operating budgets rose 3.5 percent in 2018, besting 2017’s rise of 2.8 percent and 2016’s rise of 3.4 percent gains. While slightly fewer libraries saw their operating budgets grow, those that did saw a larger increase. Resources budgets grew by 2.4 percent in 2018, a slight decrease compared to 2017’s 2.5 percent.
A Strategic Library 2020 Library Purchasing Survey of libraries of all types reported that almost 60 percent of respondents had a flat budget. The latest Publishers Communication Group (PCG) whitepaper Library Budget Predictions for 2018 reports that overall library budget predictions for growth are modest at a 1 percent increase. Asia Pacific countries continue to provide higher levels of growth (3 percent) compared to large markets in Europe (0.4 percent increase) and North America (0.2 percent decrease). According to PCG, this growth will not aid librarians’ purchasing power—in fact, it will be challenging just to maintain existing holdings. Simba Information’s Global Scientific & Technical Publishing 2019-2023 report notes that while academic library budgets are expected to grow moderately in the future (1.3 to 1.8 percent), mirroring the increase in budgets for higher education, this does not always translate to increases in collections budgets. Simba points to a shift in publishers’ mergers and acquisitions as they invest in related service areas such as analytical tools, workflow solutions, and artificial intelligence, as opposed to acquiring more content by buying smaller publishers.
METHODOLOGY
The price survey, with the exception of Table 3, uses a print-preferred pricing model based on the standard retail price for the titles in the selected indexes. Print pricing is used for consistency because not all publishers make their online-only pricing available or have a standard online-only retail price. The index contains pricing for print plus online and online-only only if those were the only rates offered. Print-only pricing is now 35 percent of the data used in these tables, so, despite difficulties in getting online pricing, more journals are shifting to some form of online for their pricing, reflecting the overall decline in print.
The survey uses a combination of title sets to provide different views of the impact of inflation on libraries. Titles indexed in the Clarivate Analytics Citation Indexes (Arts and Humanities, Science, and Social Science) and titles from SCOPUS provide data that is useful for large academic libraries. The data from these indexes is sorted by discipline as well as by format. Titles indexed in EBSCO’s Academic Search Ultimate database represent the titles most held in general academic and public library collections. Titles from EBSCO’s MasterFILE Complete provide a data set germane to smaller public and school libraries.
|
TABLE 1 AVERAGE 2020 PRICE FOR SCIENTIFIC DISCIPLINES |
|
| Discipline | Average Price Per Title ($) |
| Chemistry | 6,316 |
| Physics | 5,137 |
| Engineering | 4,218 |
| Biology | 3,977 |
| Food Science | 3,414 |
| Technology | 3,223 |
| Geology | 3,110 |
| Botany | 2,812 |
| Astronomy | 2,773 |
| Zoology | 2,766 |
| Geography | 2,445 |
| Health Sciences | 2,323 |
| Agriculture | 2,222 |
| Math & Computer Science | 2,216 |
| General Science | 2,109 |
|
SOURCE: LJ PERIODICALS PRICE SURVEY 2020 |
|
TABLE 1: The average price ($6,316) for chemistry titles rose 6 percent over last year, nearly 30 percent over the average price ($4,871) reported in the 2015 Periodical Price Survey and 50 percent over the average price ($4,227) reported in the 2012 Periodical Price Survey. There were only slight shifts in relative rankings for other science, technology, and medicine (STM) subject areas. Content from the five major publishers–Elsevier, SpringerNature, Wiley, Taylor & Francis, and SAGE–continues to represent more than half (61 percent) of the titles in the merged Clarivate Analytics Indexes.
|
TABLE 2 TITLES INDEXED IN SCOPUS COST HISTORY BY LIBRARY OF CONGRESS SUBJECT |
|||||||
| SUBJECT | AVERAGE NO. OF TITLES 2018–20 | CHANGE 2018–20 | AVERAGE COST PER TITLE 2018 | AVERAGE COST PER TITLE 2019 | % OF CHANGE 2019 | AVERAGE COST PER TITLE 2020 | % of Change 2020 |
| Business & Economics | 1,852 | 335 | $1,515 | $1,583 | 5 | $1,669 | 5 |
| Fine Arts | 380 | 65 | 450 | 470 | 4 | 505 | 7 |
| Heath Sciences | 4,658 | 265 | 1,367 | 1,451 | 6 | 1,547 | 7 |
| Humanities | 2,779 | 394 | 421 | 446 | 6 | 468 | 5 |
| Law | 405 | 47 | 619 | 651 | 5 | 686 | 5 |
| Life Sciences | 2,568 | 264 | 2,054 | 2,174 | 6 | 2,279 | 5 |
| Social Sciences | 3,192 | 872 | 896 | 958 | 7 | 1,019 | 6 |
| STEM | 6,122 | 770 | 2,145 | 2,277 | 6 | 2,416 | 6 |
| TOTAL/AVERAGE | 21,956 | 3,012 | 1,459 | 1,546 | 6 | 1,638 | 6 |
|
SOURCE: LJ PERIODICALS PRICE SURVEY 2020 |
|||||||
TABLE 2: For 2020, the SCOPUS title list was adjusted to include all titles added from 2018 forward, an additional 714 titles, bringing the number of priced titles to 21,956. This is the largest sample used in the price studies; the larger data set makes results more reliable. SCOPUS data showed a 6 per cent increase for 2020.
|
TABLE 3 COST HISTORY FOR ONLINE TITLES IN CLARIVATE ANALYTICS INDEXES |
||||||
| Subject | Average No. of Titles 2018–20 | Average Cost Per Title 2018 | Average Cost Per Title 2019 | % of Change 2018–19 | Average Cost Per Title 2020 | % of Change 2019–20 |
| Agriculture | 77 | $1,240 | $1,308 | 6 | $1,385 | 6 |
| Anthropology | 33 | 601 | 640 | 6 | 682 | 7 |
| Arts & Architecture | 68 | 505 | 538 | 6 | 569 | 6 |
| Astronomy | 13 | 1,866 | 1,959 | 5 | 2,011 | 3 |
| Biology | 196 | 2,738 | 2,903 | 6 | 3,071 | 6 |
| Botany | 23 | 2,184 | 2,306 | 6 | 2,419 | 5 |
| Business & Economics | 366 | 1,809 | 1,895 | 5 | 1,990 | 5 |
| Chemistry | 69 | 5,381 | 5,660 | 5 | 5,897 | 4 |
| Education | 133 | 1,019 | 1,090 | 7 | 1,169 | 7 |
| Engineering | 191 | 2,376 | 2,512 | 6 | 2,647 | 5 |
| Food Science | 15 | 2,673 | 2,808 | 5 | 2,943 | 5 |
| General Science | 39 | 1,416 | 1,470 | 4 | 1,536 | 5 |
| General Works | 26 | 453 | 475 | 5 | 496 | 4 |
| Geography | 59 | 1,501 | 1,601 | 7 | 1,695 | 6 |
| Geology | 39 | 1,317 | 1,391 | 6 | 1,453 | 4 |
| Heath Sciences | 547 | 1,865 | 1,964 | 5 | 2,059 | 5 |
| History | 248 | 491 | 527 | 7 | 557 | 6 |
| Language & Literature | 356 | 412 | 436 | 6 | 461 | 6 |
| Law | 63 | 600 | 631 | 5 | 661 | 5 |
| Library Science | 30 | 650 | 679 | 4 | 710 | 5 |
| Math & Computer Science | 104 | 1,602 | 1,705 | 6 | 1,777 | 4 |
| Military & Naval Science | 9 | 1,142 | 1,225 | 7 | 1,289 | 5 |
| Music | 39 | 392 | 412 | 5 | 435 | 6 |
| Philosophy & Religion | 168 | 446 | 471 | 6 | 492 | 4 |
| Physics | 102 | 3,910 | 4,099 | 5 | 4,313 | 5 |
| Political Science | 87 | 832 | 895 | 8 | 952 | 6 |
| Psychology | 102 | 1,015 | 1,093 | 8 | 1,165 | 7 |
| Recreation | 35 | 835 | 887 | 6 | 936 | 5 |
| Social Sciences | 44 | 938 | 993 | 6 | 1,078 | 9 |
| Sociology | 257 | 963 | 1,024 | 6 | 1,095 | 7 |
| Technology | 47 | 2,190 | 2,384 | 9 | 2,511 | 5 |
| Zoology | 60 | 2,649 | 2,785 | 5 | 2,898 | 4 |
| TOTAL/AVERAGE | 3,645 | 1,481 | 1,565 | 6 | 1,647 | 5 |
|
SOURCE: LJ PERIODICALS PRICE SURVEY 2020 |
||||||
TABLE 3: This table examines the titles in the combined Clarivate Analytics Citation Indexes (Arts and Humanities, Science, and Social Sciences) that offer published rates for online formats. As in Table 1, STM titles have the highest average cost, with chemistry leading the pack. The 2020 average cost was $1,647. This was a 5 per cent increase over 2019. Prices are lower in this sample, as many of the large publishers use custom quotes for online prices. Consequently, those high-price journals are not in the mix.
For comparison purposes, the rate of price increase is analyzed for more than 18,000 e-journal packages handled by EBSCO Information Services. Packages are a large part of the periodicals marketplace, so the rate of price increase for these is important data. For 2020, the average rate of increase over two years was 4.3 percent, slightly lower than the 5.5 percent in 2019 and 5 percent in 2018.
|
Periodical Prices for High School and Public Libraries |
|||||||
|
TABLE 4 COST HISTORY FOR TITLES INDEX IN MASTERFILE COMPLETE |
|||||||
|
Overall price increases for titles in EBSCO Publishing’s Masterfile Premier are expected to be in the 6.0%–6.5% range. |
|||||||
| Masterfile Premier | No. of Titles 2018–20 | Average Cost Per Title 2018 | Average Cost Per Title 2019 | % of Change 2018–19 | Average Cost Per Title 2020 | % of Change 2019–20 | |
| U.S. | 977 | $285 | $306 | 7.2 | $324 | 6.0 | |
| Non-U.S. | 218 | 405 | $432 | 6.7 | 460 | 6.6 | |
|
SOURCE: LJ PERIODICALS PRICE SURVEY 2020 |
|||||||
|
Periodical Prices for University and College Libraries |
||||||||
|
TABLE 5 2021 COST PROJECTIONS FOR TITLES INDEXED IN ACADEMIC SEARCH ULTIMATE |
||||||||
|
Overall price increases for titles in EBSCO’s Academic Search Premier/Ultimate are expected to be in the 5.5%–6.0% range for 2021. |
||||||||
| Academic Search Premier | No. of Titles | % of List | 2020 Average Cost per Title | % of Cost | Projected % of Increase | Projected 2021 Average Cost per Title | % of Cost | Projected Overall % Increase |
| U.S. | 2,672 | 39 | $1,303 | 30 | 6.3 | $1,385 | 30 | 5.8 |
| Non U.S. | 4,169 | 61 | 1,976 | 70 | 5.6 | 2,087 | 70 | |
|
SOURCE: LJ PERIODICALS PRICE SURVEY 2020 |
||||||||
OPEN ACCESS
Simba reports that the OA market continues to grow, with estimated OA journal revenue representing 4.7 percent of the journal marketplace. SpringerNature is still the biggest OA journal publisher. The list of signatories of the European Union’s Plan S, which requires research funded by 19 European agencies to be published open access starting in 2021, is growing and expected to grow further. In their updated implementation guidance, cOAlition S strongly encourages institutions and consortia to develop new transformative agreements that seek a pathway to shift from payment to read (or traditional subscription-based models) to payment to publish and will only financially support agreements after January 2021 if they adhere to the Efficiency and Standards for Article Charges guidelines.
|
TABLE 6 COST HISTORY FOR TITLES IN ACADEMIC SEARCH ULTIMATE |
|||||||
| Subject | Average No. of Titles 2018–20 | Change From 2018–20 | Average Cost Per Title 2018 | Average Cost Per Title 2019 | % of Change 2018–19 | Average Cost Per Title 2020 | % of Change 2020 |
| Agriculture | 189 | -1 | $1,443 | $1,535 | 6 | $1,631 | 6 |
| Anthropology | 56 | 1 | 629 | 678 | 8 | 704 | 4 |
| Arts & Architecture | 66 | 3 | 464 | 505 | 9 | 546 | 8 |
| Astronomy | 28 | 1 | 1,291 | 1,361 | 5 | 1,418 | 4 |
| Biology | 465 | 0 | 2,930 | 3,103 | 6 | 3,271 | 5 |
| Botany | 62 | -1 | 1,559 | 1,663 | 7 | 1,764 | 6 |
| Business & Economics | 251 | 1 | 994 | 1,060 | 7 | 1,127 | 6 |
| Chemistry | 166 | 0 | 5,089 | 5,386 | 6 | 5,632 | 5 |
| Education | 280 | 1 | 873 | 945 | 8 | 1,007 | 6 |
| Engineering | 626 | 0 | 2,768 | 2,946 | 6 | 3,133 | 6 |
| Food Science | 37 | -1 | 1,688 | 1,805 | 7 | 1,909 | 6 |
| General Science | 83 | 0 | 1,587 | 1,691 | 7 | 1,789 | 6 |
| General Works | 101 | 3 | 276 | 288 | 4 | 299 | 4 |
| Geography | 98 | 1 | 1,480 | 1,593 | 8 | 1,699 | 7 |
| Geology | 82 | 0 | 2,502 | 2,674 | 7 | 2,826 | 6 |
| Heath Sciences | 1,287 | 6 | 1,581 | 1,665 | 5 | 1,784 | 7 |
| History | 407 | 3 | 441 | 477 | 8 | 507 | 6 |
| Language & Literature | 339 | -1 | 451 | 483 | 7 | 513 | 6 |
| Law | 245 | 2 | 380 | 398 | 5 | 422 | 6 |
| Library Science | 85 | 0 | 686 | 728 | 6 | 768 | 5 |
| Math & Computer Science | 282 | 2 | 1,975 | 2,082 | 5 | 2,186 | 5 |
| Military & Naval Science | 39 | 0 | 585 | 638 | 9 | 680 | 7 |
| Music | 94 | 1 | 205 | 216 | 6 | 230 | 7 |
| Philosophy & Religion | 327 | 0 | 326 | 348 | 7 | 364 | 5 |
| Physics | 186 | 2 | 3,908 | 4,107 | 5 | 4,308 | 5 |
| Political Science | 123 | -1 | 698 | 752 | 8 | 798 | 6 |
| Psychology | 185 | 2 | 915 | 978 | 7 | 1,044 | 7 |
| Recreation | 39 | 0 | 817 | 884 | 8 | 943 | 7 |
| Social Sciences | 50 | 3 | 796 | 866 | 9 | 929 | 7 |
| Sociology | 358 | 0 | 970 | 1,044 | 8 | 1,112 | 7 |
| Technology | 69 | 0 | 2,007 | 2,122 | 6 | 2,230 | 5 |
| Zoology | 127 | -1 | 1,499 | 1,559 | 4 | 1,605 | 3 |
| TOTAL/AVERAGE | 6,832 | 26 | 1,527 | 1,620 | 6 | 1,716 | 6 |
|
SOURCE: LJ PERIODICALS PRICE SURVEY 2020 |
|||||||
As demand for OA publishing grows, the market has responded by offering a myriad of options, often customized to an institution or consortia. It’s clear that a single approach to OA won’t work for everyone. Various flavors of transformative license models have evolved in recent years. Rick Anderson’s survey on Open Access Working toward transformative models shows publisher cooperation is positive. All five of the largest publishers, as well as smaller ones, have signed one or more transformative agreements. The Subscribe to Open Model allows publishers to convert journals to OA after one year or after they reach a certain number of “paid” articles. It aligns with OA2020. New transformative agreements may be with an individual library, a system, or a consortium. Other models include Read and Publish (RAP) agreements and Publish and Read. Thus, following the money in OA models has become extremely complex. Article Processing Charges are paid from many sources, including authors themselves, their respective institutions, grant monies, and even library funds.
For learned societies, it is mission as usual, but not business as usual. Concerns about how they are to prepare for OA mandates loom. The forming of the Society Publishers’ Coalition and Transitioning Society Publications to Open Access suggest that societies realize they need to move quickly to adapt.
|
TABLE 7 TITLES IN CLARIVATE ANALYTICS INDEXES COST HISTORY BY LIBRARY OF CONGRESS SUBJECT |
|||||||
| Subject | Average No. of Titles 2018–20 | Change From 2018–20 | Average Cost Per Title 2018 | Average Cost Per Title 2019 | % of Change 2018–20 | Average Cost Per Title 2020 | % of Change 2020 |
| Agriculture | 125 | 0 | $1,969 | $2,107 | 7 | $2,222 | 5 |
| Anthropology | 48 | -1 | $610 | $650 | 7 | $678 | 4 |
| Arts & Architecture | 98 | 0 | $455 | $482 | 6 | $514 | 7 |
| Astronomy | 16 | 1 | $2,653 | $2,638 | -1 | $2,773 | 5 |
| Biology | 399 | 0 | $3,570 | $3,774 | 6 | $3,977 | 5 |
| Botany | 34 | 1 | $2,541 | $2,651 | 4 | $2,812 | 6 |
| Business & Economics | 539 | 0 | $1,824 | $1,934 | 6 | $2,031 | 5 |
| Chemistry | 149 | -1 | $5,722 | $6,063 | 6 | $6,316 | 4 |
| Education | 165 | 2 | $1,118 | $1,202 | 7 | $1,292 | 7 |
| Engineering | 338 | 1 | $3,755 | $3,991 | 6 | $4,218 | 6 |
| Food Science | 22 | 0 | $3,021 | $3,219 | 7 | $3,414 | 6 |
| General Science | 58 | 0 | $1,865 | $1,984 | 6 | $2,109 | 6 |
| General Works | 74 | 2 | $251 | $261 | 4 | $272 | 4 |
| Geography | 86 | 0 | $2,143 | $2,302 | 7 | $2,445 | 6 |
| Geology | 70 | 0 | $2,761 | $2,943 | 7 | $3,110 | 6 |
| Health Sciences | 1,066 | -5 | $2,050 | $2,187 | 7 | $2,323 | 6 |
| History | 332 | 6 | $489 | $525 | 7 | $552 | 5 |
| Language & Literature | 447 | 0 | $438 | $466 | 6 | $491 | 5 |
| Law | 107 | 1 | $496 | $514 | 4 | $544 | 6 |
| Library Science | 46 | -1 | $852 | $909 | 7 | $962 | 6 |
| Math & Computer Science | 154 | 0 | $2,047 | $2,145 | 5 | $2,216 | 3 |
| Military & Naval Science | 13 | 0 | $1,077 | $1,173 | 9 | $1,239 | 6 |
| Music | 55 | 0 | $352 | $370 | 5 | $388 | 5 |
| Philosophy & Religion | 210 | 1 | $429 | $455 | 6 | $469 | 3 |
| Physics | 155 | 2 | $4,705 | $4,936 | 5 | $5,137 | 4 |
| Political Science | 97 | 0 | $946 | $1,022 | 8 | $1,090 | 7 |
| Psychology | 159 | 4 | $1,154 | $1,207 | 5 | $1,288 | 7 |
| Recreation | 41 | 0 | $880 | $945 | 7 | $1,013 | 7 |
| Social Sciences | 60 | 1 | $984 | $1,043 | 6 | $1,108 | 6 |
| Sociology | 302 | 0 | $1,115 | $1,199 | 8 | $1,281 | 7 |
| Technology | 59 | 1 | $2,885 | $3,030 | 5 | $3,223 | 6 |
| Zoology | 81 | 0 | $2,568 | $2,682 | 4 | $2,766 | 3 |
| TOTAL/AVERAGE | 5,604 | 15 | $1,897 | $2,011 | 6 | $2,119 | 5 |
|
SOURCE: LJ PERIODICALS PRICE SURVEY 2020 |
|||||||
In the United States, at press time an Executive Order might be forthcoming that will call for immediate free access to publications resulting from federally sponsored research, similar to Plan S. Some scientific and academic publishers oppose this, which has the potential to upend the scientific publishing business. The Executive Order builds on legislation passed by Congress in 2008 requiring research papers funded by the National Institutes of Health to be freely available to all no later than 12 months after publication. In 2014, this mandate was extended to all federally funded research.
While OA is steadily gaining momentum, the fundamental question of where the money required to support OA publishing will come from remains unanswered. Library budgets of large, research-intensive organizations are not sufficient to cover the costs of the current scholarly communications system and make up the loss of revenue streams from non-research university sources.
|
TABLE 8 2021 COST PROJECTIONS BY BROAD SUBJECT |
|||||||||
| No. of Titles | % of List | 2020 Cost | % of Cost | Av. Cost per Title | Projected % of Increase | Projected 2021 Cost | % of Cost | Projected Overall % Increase | |
| ARTS AND HUMANITIES CITATION INDEX | |||||||||
| U.S. | 455 | 30 | $116,701 | 20 | $256 | 5.1 | $122,653 | 20 | 5.5 |
| NON-U.S. | 1,038 | 70 | 470,533 | 80 | 453 | 5.6 | 496,883 | 80 | |
| SOCIAL SCIENCES CITATION INDEX | |||||||||
| U.S. | 903 | 40 | 799,749 | 28 | 886 | 7.0 | 855,732 | 28 | 6.1 |
| NON-U.S. | 1,345 | 60 | 2,107,068 | 72 | 1,567 | 5.7 | 2,227,171 | 72 | |
| SCIENCE CITATION INDEX | |||||||||
| U.S. | 1,065 | 42 | 2,962,318 | 35 | 2,782 | 5.9 | 3,137,095 | 35 | 5.4 |
| NON-U.S. | 1,448 | 58 | 5,437,368 | 65 | 3,755 | 5.2 | 5,720,111 | 65 | |
|
PROJECTED OVERALL INCREASE FOR ALL CLARIVATE TITLES: 5.6% |
|||||||||
|
SOURCE: LJ PERIODICALS PRICE SURVEY 2020 |
|||||||||
Between OA2020 and Plan S, the promise of a robust scholarly communication ecosystem that provides open access to researchers regardless of their affiliation has never been closer, but there is still no clarity about which paths will ultimately create an OA ecosystem where costs are fairly and sustainably shared among libraries, authors, and publishers. Shifting the costs to producers instead of readers requires the creation of new management tools to provide financial oversight. Control mechanisms will change focus from what users can read to where authors may publish. Follow the money: with the future profits from publishing uncertain, publishers are investing in new services that support the research lifecycle.
2020 FORECAST
Serials business models are changing, and several new approaches have emerged. To date, none offer a solution to the problem of serial costs continuing to rise higher than library budgets. Open Access promises greater access for researchers, but it is unclear how it will be paid for. There are multiple OA paths but there is still no consensus which, if any, OA models will be sustainable and decrease the overall costs. The current model of large publishers dominating scholarly publishing and inflation grinding down library budgets continues. Even within new transformative agreements, this model persists. Following the money, fewer dollars are flowing into the library marketplace, and this has depressed price increases ever so slightly as libraries pressure suppliers to lower increases. The 5 to 6 percent average price increase observed in 2020 is expected to remain constant for 2021, and this will lead to further contraction of resources for library users.
VALUE OF JOURNALS
Journal price data is important for budget management processes, but price alone is not the sole factor determining value. Metrics such as Impact Factor are important in assessing value, and similar value metrics will only increase in importance in the future. Improvements in usage data gathering (Counter 5) and developments in the altmetrics arena may provide more data that could be used to help make qualitative assessments of scholarly publishing. Data-based decisions will be very important in determining values as libraries actively manage their information resources.
Altmetrics are not widely accepted for assessing scholarly materials, so other standardized metrics continue to dominate. There are flaws in the Impact Factor, but nothing else has arisen to replace it. This year the survey continues to work with title and publisher data collected for this article to explore the relationship between prices and metrics used to assess journals such as Impact Factor, Eigenfactor, and Article Influence Score. The relationship between serial prices and numbers of citations was explored with interesting results.
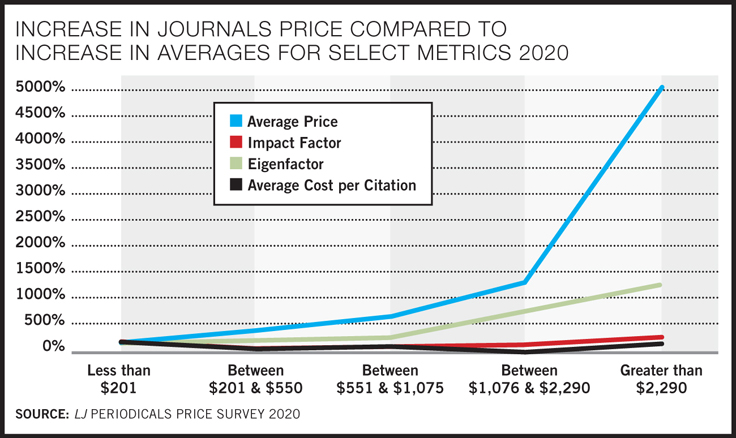
To examine the relationship between price and value, the titles in the merged Clarivate indexes for 2020 were divided into broad price categories. The selection of categories was originally based on median prices with standard deviations, and those price bands remain in use for comparison. The average for Impact Factor, Eigenfactor, and Article Influence Score for all titles in a price range was compared to the averages in the other price bands. The results are displayed in the chart above. All value metrics tended to increase with the increase in price. However, this increase was significantly less than the increase in price.
|
TABLE 9 COMPARISON OF AVERAGE PRICE OF TITLES IN CLARIVATE INDEXES GROUPED BY PRICE TO IMPACT FACTOR, ETC. |
|||||||
| Price Band | No of Titles | Average Price 2020 | % Price Increase 2019–20 | Average of Latest Impact Factor | Average Eigenfactor | Average Article Influence Score | Avg. Cost per Citation |
| Less than $201 | 771 | $109 | 2.0 | 1.81 | 0.2084 | 0.61 | $0.20 |
| Between $201 and 550 | 996 | 377 | 4.1 | 2.36 | 0.3112 | 0.95 | 0.24 |
| Between $551 and 1,075 | 1,219 | 784 | 6.5 | 2.30 | 0.5297 | 0.86 | 0.26 |
| Between $1,076 and 2,290 | 1,442 | 1,582 | 6.1 | 3.39 | 1.5780 | 1.18 | 0.21 |
| Greater than $2,290 | 1,611 | 5,525 | 5.6 | 4.06 | 2.6307 | 1.30 | 0.34 |
|
SOURCE: LJ PERIODICALS PRICE SURVEY 2020 |
|||||||
Although there were increases in the metrics for Impact Factor and Eigenfactor, the increases were not comparable to the increase in price. The average price ($5,525) for the most expensive journals was 50 times higher than the least expensive ($109) journals, while the Impact Factor slightly more than doubled. The price increases for the more moderately priced titles were also lower than the more expensive titles. This analysis continues to show that higher priced titles do have higher Impact Factors and Eigenfactors, but the increase in the metrics is small when compared with the huge increase in costs.
|
TABLE 10 COMPARISON OF SERIAL PRICES WITH RATES OF CITATION BASED ON TITLES IN CLARIVATE ANALYTICS INDEXES |
||||
| Subject | No of Titles | Total Cost | Total Citations | Cost per Cite |
| General Science | 89 | 136627.82 | 1932811 | $0.07 |
| Astronomy | 18 | 44361.22 | 291528 | 0.15 |
| Heath Sciences | 1408 | 2801584.27 | 13081253 | 0.21 |
| Geology | 73 | 217789.98 | 927782 | 0.23 |
| Engineering | 357 | 1459200.25 | 6206089 | 0.24 |
| Chemistry | 171 | 941045.58 | 3992523 | 0.24 |
| Biology | 479 | 1649699.19 | 6926943 | 0.24 |
| Psychology | 200 | 236412.7 | 967501 | 0.24 |
| Physics | 178 | 811769.67 | 3309992 | 0.25 |
| Agriculture | 140 | 279510.48 | 897173 | 0.31 |
| Botany | 41 | 95604 | 303162 | 0.32 |
| Technology | 74 | 217790.37 | 683638 | 0.32 |
| Food Science | 24 | 75113 | 229400 | 0.33 |
| Geography | 108 | 217694.61 | 583792 | 0.37 |
| Law | 146 | 61973.82 | 125990 | 0.49 |
| Math & Computer Science | 164 | 353572.07 | 713802 | 0.50 |
| Business & Economics | 625 | 1191646.4 | 2366284 | 0.50 |
| Sociology | 346 | 412174.74 | 793742 | 0.52 |
| Anthropology | 59 | 35678.29 | 68148 | 0.52 |
| Zoology | 99 | 230660.27 | 423557 | 0.54 |
| Political Science | 105 | 105746.05 | 164556 | 0.64 |
| Education | 188 | 223120.62 | 344121 | 0.65 |
| Library Science | 61 | 56581.73 | 86379 | 0.66 |
| Recreation | 54 | 50850.79 | 76425 | 0.67 |
| Social Sciences | 69 | 69976.85 | 100308 | 0.70 |
| Military & Naval Science | 15 | 19021.84 | 23228 | 0.82 |
| History | 380 | 187885.35 | 131416 | 1.43 |
| Language & Literature | 535 | 226255.66 | 144383 | 1.57 |
| General Works | 85 | 20386.98 | 11207 | 1.82 |
| Arts & Architecture | 121 | 51027.54 | 20096 | 2.54 |
| Music | 62 | 21326.29 | 7744 | 2.75 |
| Philosophy & Religion | 262 | 98997.64 | 19121 | 5.18 |
| TOTAL/AVERAGE | 6,736 | 12,601,086 | 45,954,094 | 0.27 |
|
SOURCE: LJ PERIODICALS PRICE SURVEY 2020 |
||||
The ratio of citations to serial costs by subject is reviewed in Table 10. For STM journals, the average prices tend to be high in comparison to other subjects. This scenario changes if the costs are divided by the numbers of citations. Chemistry has the highest average price, but the sixth lowest cost per citation. Journals in chemistry are very expensive but heavily cited. If citations are considered an indicator of value, then chemistry journals, despite high average prices, are high-value journals. Conversely, journals in philosophy, music, and art are relatively cheap but are infrequently cited, so journals in those areas show the highest cost per citation.
Based upon this set of data, if cost per citation is reviewed by type of publisher, it is not surprising that commercial publishers have higher per citation costs than other types of publishers. Commercial publishers showed
a cost per citation of 38¢ and an average price of $2,478, while university presses showed 18¢ and an average price of $572, and societal publishers showed 7¢ and an average price of $1,388.
Stephen Bosch is Materials Budget, Procurement, and Licensing Librarian, University of Arizona Library, Tucson; Barbara Albee is Account Services Manager, EBSCO Information Services, Birmingham, AL; and Sion Romaine is Director of Acquisitions & Rapid Cataloging Services at the University of Washington Libraries, Seattle

Added To Cart
RELATED


RECOMMENDED


TECHNOLOGY

ALREADY A SUBSCRIBER? LOG IN
We are currently offering this content for free. Sign up now to activate your personal profile, where you can save articles for future viewing
ALREADY A SUBSCRIBER? LOG IN
Thank you for visiting.
We’ve noticed you are using a private browser. To continue, please log in or create an account.

Add Comment :-
Comment Policy:
Comment should not be empty !!!